Figures & data
Figure 1 Current model of mTOR regulation. The mTOR complex is regulated by numerous upstream kinase molecules. Neurofibromin (Nf1 gene product) loss leads to increased RAS activity, leading to AKT-mediated phosphorylation of PRAS40 and release of PRAS40-mediated mTOR inhibition. In addition, the increased RAS activity in Nf1-deficient cells leads to MEK activation, which phosphorylates tuberin (TSC complex), and increased Rheb-mediated mTOR activation. Lastly, LKB1 activates AMPK, which inhibits TSC complex function, such that loss of function mutations in LKB1 lead to increased Rheb-mediated mTOR activation.
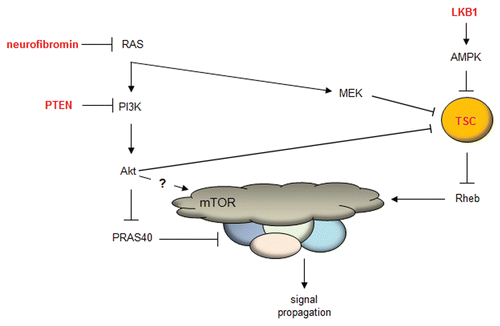
Figure 2 Anatomy of the mTOR protein. The mTOR protein is composed of several domains, including a HEAT (Huntington, EF3A, ATM, TOR), FAT (FRAP, ATM, TTRAP), R (TOR), FATC (FRAP, ATM, TRRAP C-terminal) and kinase domain. The amino acid residues are shown along the bottom.
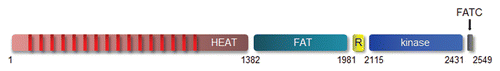
Figure 3 mTOR complexes. mTOR is composed of two distinct complexes, mTORC1 and mTORC2. TORC1 is composed of mLST8, RAPTOR, DEPTOR and PRAS40, while the mTORC2 complex is composed of mSIN1, mLST8, RICTOR and DEPTOR. mTORC1 signals to S6K1, 4EBP1 and IRS1, whereas mTORC2 activates AKT, SGK1 and PKCα.
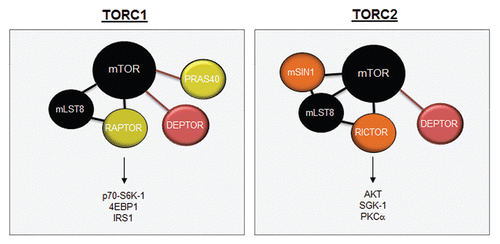
Figure 4 mTOR functions as a molecular integrator. Various inputs to mTOR provide information about amino acid availability, growth factor mitogenic signaling, oxidative damage and oxygen levels. This information must be integrated by mTOR through the use of its binding partners to provide meaningful outputs that dictate mRNA transcription, protein translation, cell growth, cell survival, ribosomal biogenesis and autophagy.
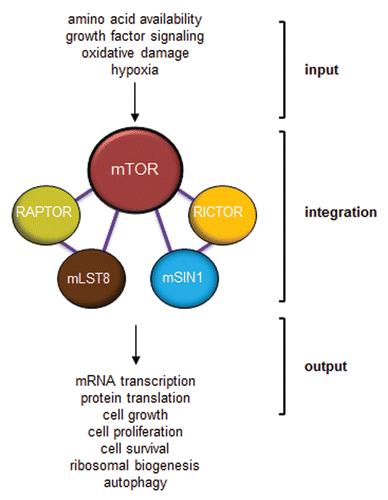
Figure 5 Control of translation by mTORC1 and mTORC2. mTORC1 controls cap-dependent translation through the phosphorylation and inactivation of 4EBP1, freeing eIF4E to bind to the 7-methylguanosine (m7G) cap structure at the 5′ end of mature mRNAs. S6K-1 phosphorylates eIF4G to initiate its interaction with eIF4G at the cap while also inactivating PCD4, the negative regulator of the eIF4A RNA helicase. mTORC1 (in astrocytes) and S6K-1 (in fibroblasts) stimulates the increased expression of nucleophosmin (NPM), which acts in a rate-limiting manner to transport mature 40S and 60S ribosome subunits from the nucleolus/nucleus into the cytosol, where they engage in mRNA translation. mTORC2 interacts with rpL23 and rpL26 of the 60S subunit on polysomes during translational elongation. Inhibition of mTORC1 or mTORC2 dramatically attenuates mRNA translation.
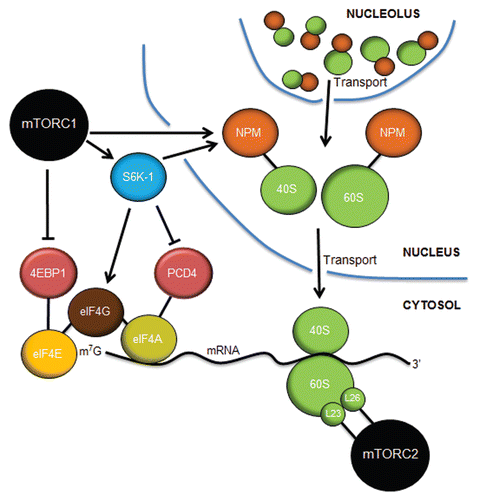
Figure 6 mTOR signaling in the brain does not follow the established canonical rules. (A) In astrocytes, neurofibromin negatively regulates mTOR through RAS/AKT-mediated signaling. Loss of neurofibromin leads to increased mTOR activation, which results in Rac1 and STAT3 activation through RAPTOR. (B) While tuberin phosphorylation results in loss of TSC complex function and increased RHEB-mediated mTOR activation, NF1 protein (neurofibromin) and PTEN loss in astrocytes leads to AKT-dependent mTOR activation, which does not involve TSC complex regulation. Moreover, Tsc1/Tsc2 inactivation or Rheb overexpression in vitro or in vivo does not recapitulate the effects of Nf1 or Pten loss on astrocyte growth or gliomagenesis in genetically engineered mice. (C) mTOR-regulated AKT activation in neural stem cells (NSCs) following Nf1 gene loss is controlled by the levels of RAPTOR and RICTOR. NSCs from the cortex fail to activate AKT and increase their proliferation following Nf1 loss, whereas those from the brainstem activate AKT and exhibit increased proliferation. This region-specific difference reflects the relative abundance of RAPTOR and RICTOR in NSCs from these two brain regions.
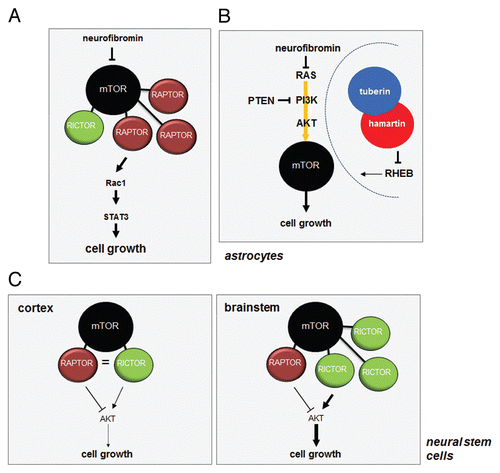
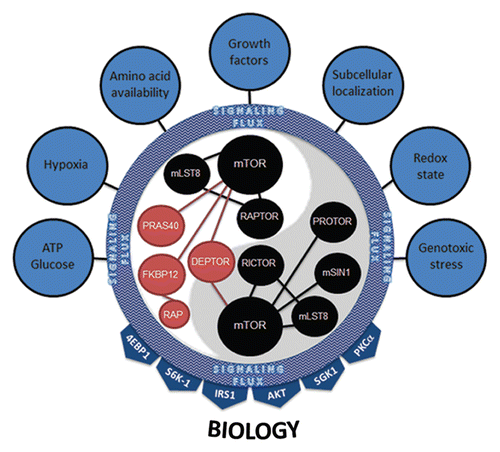
Figure 7 mTORC1 and mTORC2 integrate multiple inputs and stimulate numerous effectors. Seven major categories of inputs signal to mTOR complexes. Their combined inputs are viewed as aggregate signaling flux that is ultimately interpreted by both mTORC1 and mTORC2. The dynamics of this interpretation most likely involve changes in the protein expression level of positive (black) and negative (red) regulators of mTOR kinase activity, post-translational modification of mTORC members, binding of complexes to downstream effectors or, most likely, a combination of all of these. mTOR complexes then activate downstream signaling effectors based on their interpretation of the aggregate signaling flux flowing into mTORC1 and mTORC2. The 4EBP1, S6K-1, IRS1, AKT, SGK1 and PKCαy effectors coalesce to illicit the proper cellular biology (e.g., ribosome biogenesis, translation, growth, proliferation, survival, autophagy, lipid biogenesis, cytoskeletal changes, angiogenesis).