1,135
Views
26
CrossRef citations to date
0
Altmetric
Report

Independent transcriptional reprogramming and apoptosis induction by cisplatin

, , , , , , , , , , , , , , , , & show all
Pages 3472-3480 | Published online: 23 Aug 2012

Figures & data

Figure 1. Response of isolated mitochondria to cisplatin (CDDP), C2-ceramide (C2-CER) and cadmium dichloride (CdCl2). (A) Large-amplitude swelling categories based on the intensity and kinetics of decreasing absorbance. (B) Direct mitochondrion-permeabilizing effects of 50 μM GD3 ganglioside (GD3) and increasing concentrations (C1-C3) of Ca2+ (500 and 100 μM)CDDP (20, 100 or 200 μM), C2-CER (5, 50 or 100 μM) and CdCl2 (20, 50 or 100 μM). (C) Response of 50 μM Ca2+-, and CdCl2-mediated swelling to increasing concentrations (C1-C2) of the following swelling inhibitors: bongkrekic acid (BA, 10 or 40 μM), cyclosporine A (CsA, 5 or 10 μM), N-acetyl-cysteine (NAC, 2 or 10 mM) and non-oxidized glutathione (GSH, 0.1 or 0.5 mM).
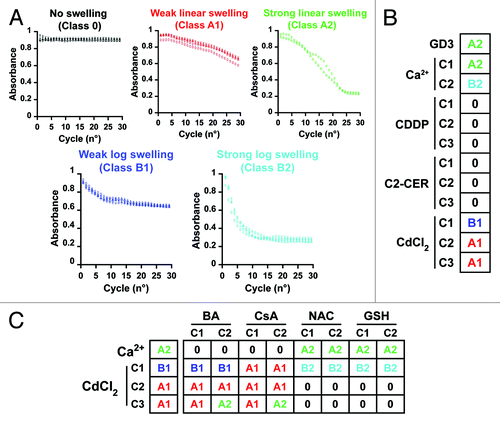
Figure 1. Response of isolated mitochondria to cisplatin (CDDP), C2-ceramide (C2-CER) and cadmium dichloride (CdCl2). (A) Large-amplitude swelling categories based on the intensity and kinetics of decreasing absorbance. (B) Direct mitochondrion-permeabilizing effects of 50 μM GD3 ganglioside (GD3) and increasing concentrations (C1-C3) of Ca2+ (500 and 100 μM)CDDP (20, 100 or 200 μM), C2-CER (5, 50 or 100 μM) and CdCl2 (20, 50 or 100 μM). (C) Response of 50 μM Ca2+-, and CdCl2-mediated swelling to increasing concentrations (C1-C2) of the following swelling inhibitors: bongkrekic acid (BA, 10 or 40 μM), cyclosporine A (CsA, 5 or 10 μM), N-acetyl-cysteine (NAC, 2 or 10 mM) and non-oxidized glutathione (GSH, 0.1 or 0.5 mM).

Figure 2. Transcriptional signatures of A549 cells responding to cisplatin (CDDP), C2-ceramide (C2-CER) and cadmium dichloride (CdCl2). (A) Graphical representation of the absolute number of gene products significantly up- or downregulated in A549 cells by the administration of CDDP, C2-CER and CdCl2 for 12 or 24 h. (B) Unsupervised hierarchical clustering of the transcriptional signatures represented in (A). Please note that each experimental condition has been analyzed twice, with dye-swapped samples. FC = fold change, as compared with control conditions (untreated cells). See also, Spreadsheets S1–S3.

Figure 2. Transcriptional signatures of A549 cells responding to cisplatin (CDDP), C2-ceramide (C2-CER) and cadmium dichloride (CdCl2). (A) Graphical representation of the absolute number of gene products significantly up- or downregulated in A549 cells by the administration of CDDP, C2-CER and CdCl2 for 12 or 24 h. (B) Unsupervised hierarchical clustering of the transcriptional signatures represented in (A). Please note that each experimental condition has been analyzed twice, with dye-swapped samples. FC = fold change, as compared with control conditions (untreated cells). See also, Spreadsheets S1–S3.

Figure 3. Transcriptional signatures of A549 cells responding to cisplatin (CDDP), C2-ceramide (C2-CER) and cadmium dichloride (CdCl2). (A) Graphical representation of time-specific transcriptional signatures exhibited by A549 cells treated with CDDP, C2-CER and CdCl2 for 12 or 24 h. (B) Graphical representation of time-correlated transcriptional signatures exhibited by A549 cells as in (A). See also, Spreadsheets S1–S4.
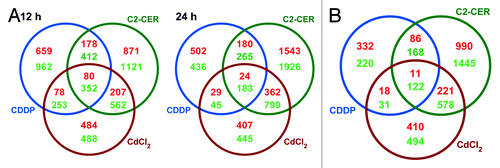
Figure 3. Transcriptional signatures of A549 cells responding to cisplatin (CDDP), C2-ceramide (C2-CER) and cadmium dichloride (CdCl2). (A) Graphical representation of time-specific transcriptional signatures exhibited by A549 cells treated with CDDP, C2-CER and CdCl2 for 12 or 24 h. (B) Graphical representation of time-correlated transcriptional signatures exhibited by A549 cells as in (A). See also, Spreadsheets S1–S4.

Table 1. Transcriptional modulation of cisplatin (CDDP)-response modifiers (excerpt from Spreadsheet S5)

Figure 4. Response to cisplatin (CDDP), C2-ceramide (C2-CER) and cadmium dichloride (CdCl2) of a panel of Saccharomyces cerevisiae knockout strains. Clonogenic survival of a panel of Saccharomyces cerevisiae strains deficient for the indicated genes upon treatment with CDDP (left panel), C2-CER (middle panel) or CdCl2 (right panel). Data are represented as means ± SEM (n = 3) upon normalization to the clonogenic survival of parental (either haploid BY4741 or diploid BY4743, as appropriate) cells treated with the same compound. *p < 0.05, **p < 0.01 (Student’s t-test), as compared with parental cells.
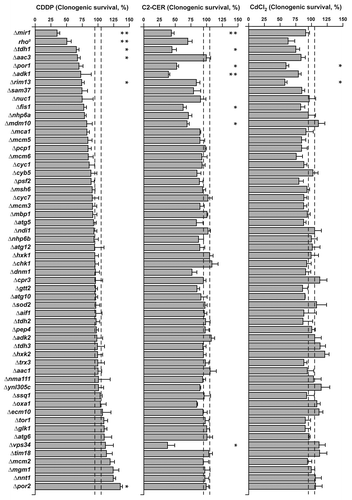
Figure 4. Response to cisplatin (CDDP), C2-ceramide (C2-CER) and cadmium dichloride (CdCl2) of a panel of Saccharomyces cerevisiae knockout strains. Clonogenic survival of a panel of Saccharomyces cerevisiae strains deficient for the indicated genes upon treatment with CDDP (left panel), C2-CER (middle panel) or CdCl2 (right panel). Data are represented as means ± SEM (n = 3) upon normalization to the clonogenic survival of parental (either haploid BY4741 or diploid BY4743, as appropriate) cells treated with the same compound. *p < 0.05, **p < 0.01 (Student’s t-test), as compared with parental cells.
Supplemental material

Additional material

Download Zip (3.5 MB)