Figures & data
Table 1. Peripheral blood cell counts of pIpC-administered mybf/f/MxCre and myb-/f/MxCre mice
Figure 1. c-myb is required for the formation of myeloid progenitor CMP, GMP and MEP cells in the bone marrow of pIpC-induced mybf/f/MxCre mice. (A) RT-PCR showing the level of c-myb expression in various myeloid progenitor cells CMP, GMP and MEP from BM of wild-type mouse. (B) Representative two-color flow cytometric analysis of myeloid progenitor cells CMP, GMP and MEP from 35 pIpC-administered mybf/f/MxCre mice (KO) and 35 pIpC-treated control littermates (CON). (C) Bar graph depicts the absolute number of progenitor cells CMP, GMP and MEP (× 104) in pIpC-administered animals. *, p < 0.001. Numbers are presented as mean ± SEM n = 35 mice for each genotype. Lin+, lineage-positive BM cells.
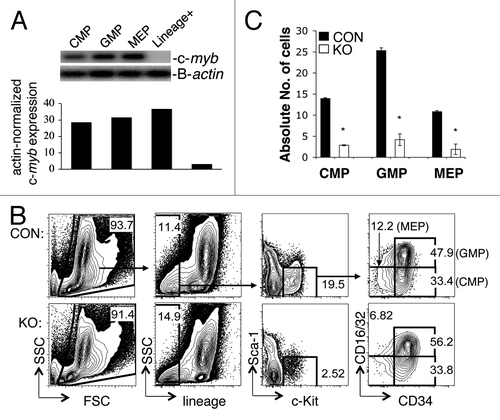
Figure 2. c-myb is required intrinsically for the growth and differentiation of myeloid progenitor CMP and GMP, and precursor CFU-G and CFU-M cells. Hematopoietic colony assays performed using untreated or 16 h interferon (IFN) treated purified (A) CMPs (n = 9) and (B) GMPs (n = 8) from mybf/f/MxCre mice and littermate controls. The number of colonies from the three groups was normalized to the untreated control, which was set to 100%. Legends for (B) are shown in (A). Granulocytic (G), erythroid (E), monocytic (M), megakaryocytic (Meg) and various (Mix) myeloid CFU colonies are shown. Data are expressed as mean ± SEM *, p < 0.001.
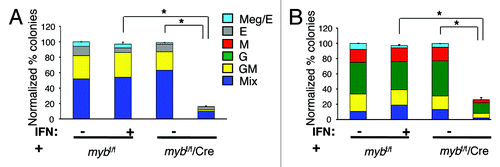
Figure 3. c-myb regulates the functionality of CMPs. Following 48 h interferon treatment to induce the disruption of c-myb, the purified CMPs were stained for surface expression of various markers. Shown are the representative (A) overlay histograms and (B and E) two-color flow cytometric analysis of various surface antigens on CMPs, purified from mybf/f/MxCre mice and littermate controls. Representative overlay histograms of antigens on (C) the CD11b+Gr-1+ and (D) the CD11b+Gr-1- cell compartments. Legends for (C and D) are same as (A). Panels are representative of three independent experiments. The percentages for each surface marker in the indicated bar region of the histograms are specified for IFN-treated mybf/f (black) and IFN-treated mybf/f/MxCre (gray) cells.
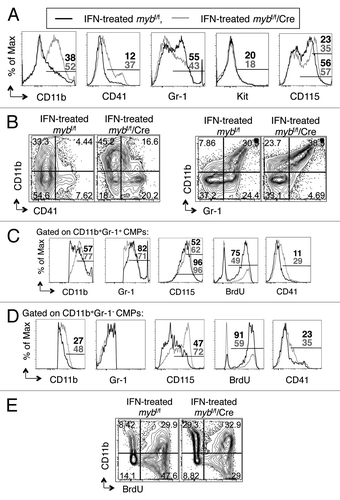
Figure 4. c-myb is required for the functionality of GMPs. Following 48 h interferon treatment to induce the disruption of c-myb, the purified GMPs were stained for surface expression of various markers. Shown are the representative (A) overlay histograms and (B and E) two-color flow cytometric analysis of various surface antigens on GMPs, purified from mybf/f/MxCre mice and littermate controls. Representative overlay histograms of antigens on (C) the CD11b+Gr-1+ and (D) the CD11b+Gr-1- cell compartments. Legends for (C and D) are same as (A). Panels are representative of three independent experiments. The percentages for each surface marker in the indicated bar region of the histograms are specified for IFN-treated mybf/f (black) and IFN-treated mybf/f/MxCre (gray) cells.
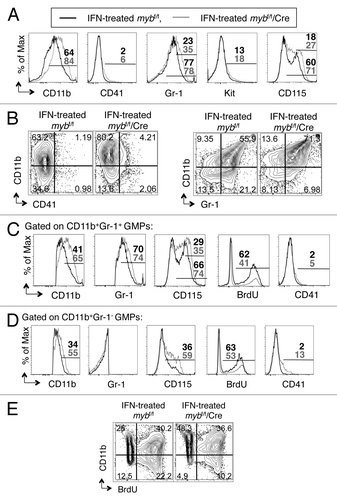
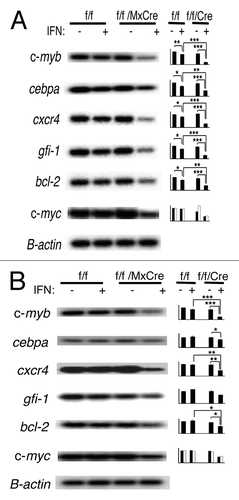
Figure 5. Disruption of c-myb results in altered gene expression in CMPs and GMPs. RT-PCR analysis of gene expression of (A) CMPs and (B) GMPs after 18 h of interferon treatment is shown. Results reflect at least three independent experiments. In the case of c-myc, results were from two independent sorts. Data on bar graph are β-actin normalized gene expression (y-axis) and are expressed as mean ± SEM *, p < 0.05; **, p < 0.01; ***, p < 0.001.