1,364
Views
17
CrossRef citations to date
0
Altmetric
Report

Ser2481-autophosphorylated mTOR colocalizes with chromosomal passenger proteins during mammalian cell cytokinesis

, , , , , , & show all
Pages 4211-4221 | Published online: 24 Oct 2012

Figures & data

Figure 1. Prolonged treatment of human cancer-derived carcinoma cells with rapamycin inhibits mTOR phosphorylation at Ser2481. Actively growing HeLa, MCF-7, A431 and A459 human epithelial carcinoma cells were cultured in the absence or presence of 100 nmol/L rapamycin for 24 h. Whole-cell lysates were analyzed by immunoblotting with antibodies specific for phospho-mTORSer2481 or total mTOR (control), as specified. The figure shows a representative immunoblotting analysis. Equivalent results were obtained in three independent experiments.

Figure 1. Prolonged treatment of human cancer-derived carcinoma cells with rapamycin inhibits mTOR phosphorylation at Ser2481. Actively growing HeLa, MCF-7, A431 and A459 human epithelial carcinoma cells were cultured in the absence or presence of 100 nmol/L rapamycin for 24 h. Whole-cell lysates were analyzed by immunoblotting with antibodies specific for phospho-mTORSer2481 or total mTOR (control), as specified. The figure shows a representative immunoblotting analysis. Equivalent results were obtained in three independent experiments.

Figure 2. Spatiotemporal dynamics of phospho-mTORSer2481 during mitosis and cytokinesis. After fixation and permeabilization of asynchronously growing HeLa cells in 96-well clear-bottom imaging tissue culture plates optimized for automated imaging applications, cells were double-stained with antibodies against phospho-mTORSer2481 and α-tubulin and with Hoechst 33258 for nuclear counterstaining. The figure shows representative portions of images containing dividing cells captured with a 40x objective in the channels corresponding to phospho-mTORSer2481 (green), α-tubulin (red) and Hoechst 33258 (blue), and the images were merged with a BD Pathway™ 855 Bioimager System using BD Attovision™ software.
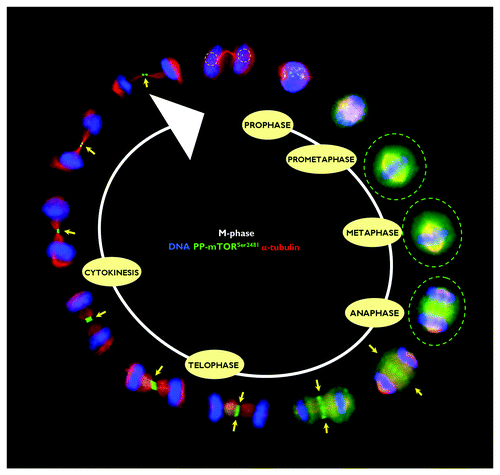
Figure 2. Spatiotemporal dynamics of phospho-mTORSer2481 during mitosis and cytokinesis. After fixation and permeabilization of asynchronously growing HeLa cells in 96-well clear-bottom imaging tissue culture plates optimized for automated imaging applications, cells were double-stained with antibodies against phospho-mTORSer2481 and α-tubulin and with Hoechst 33258 for nuclear counterstaining. The figure shows representative portions of images containing dividing cells captured with a 40x objective in the channels corresponding to phospho-mTORSer2481 (green), α-tubulin (red) and Hoechst 33258 (blue), and the images were merged with a BD Pathway™ 855 Bioimager System using BD Attovision™ software.
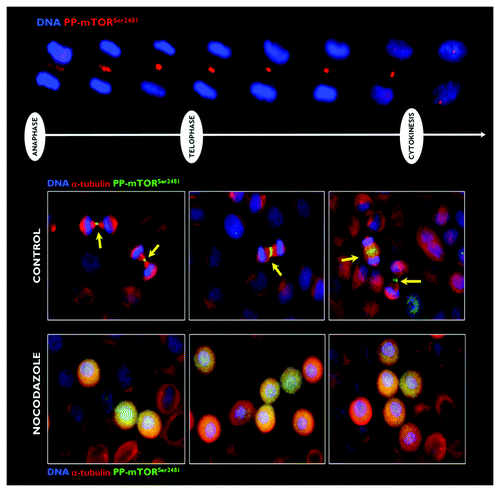
Figure 3. Effect of microtubule depolymerization on the central spindle/midzone localization of phospho-mTORSer2481. Top: Spatiotemporal dynamics of phospho-mTORSer2481 during mitosis and cytokinesis in A431 epidermoid cancer cells, which were double-stained with antibodies against phospho-mTORSer2481 (red) and Hoechst 33258 (blue) for nuclear counterstaining. Bottom: Representative images of asynchronous A431 cell cultures propagated under normal conditions (leftpanels) or exposed to 0.2 μg/mL nocodazole for 6-h G2 arrest (right panels). Images were captured with a 20x objective in the channels corresponding to phospho-mTORSer2481 (green), α-tubulin (red) and Hoechst 33258 (blue), and the images were merged with a BD Pathway™ 855 Bioimager System using BD Attovision™ software.

Figure 3. Effect of microtubule depolymerization on the central spindle/midzone localization of phospho-mTORSer2481. Top: Spatiotemporal dynamics of phospho-mTORSer2481 during mitosis and cytokinesis in A431 epidermoid cancer cells, which were double-stained with antibodies against phospho-mTORSer2481 (red) and Hoechst 33258 (blue) for nuclear counterstaining. Bottom: Representative images of asynchronous A431 cell cultures propagated under normal conditions (leftpanels) or exposed to 0.2 μg/mL nocodazole for 6-h G2 arrest (right panels). Images were captured with a 20x objective in the channels corresponding to phospho-mTORSer2481 (green), α-tubulin (red) and Hoechst 33258 (blue), and the images were merged with a BD Pathway™ 855 Bioimager System using BD Attovision™ software.

Figure 4. Co-localization analysis of phospho-mTORSer2481 and the CPP INCENP during mitosis and cytokinesis. Asynchronously growing A431 cells were fixed and stained as described in the Materials and Methods. The figure shows representative portions of images containing dividing cells captured with a 40x objective in the channels corresponding to phospho-mTORSer2481 (red), INCENP (green) and Hoechst 33258 (blue), and the images were merged with a BD PathwayTM 855 Bioimager System using BD AttovisionTM software. The rectangular regions (white lines) are enlarged and shown as high-magnification insets in the right panels.
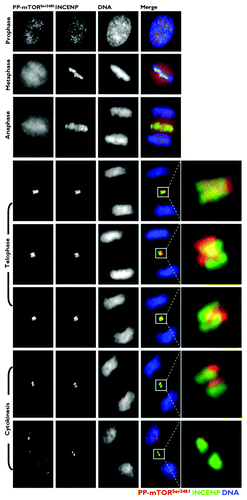
Figure 4. Co-localization analysis of phospho-mTORSer2481 and the CPP INCENP during mitosis and cytokinesis. Asynchronously growing A431 cells were fixed and stained as described in the Materials and Methods. The figure shows representative portions of images containing dividing cells captured with a 40x objective in the channels corresponding to phospho-mTORSer2481 (red), INCENP (green) and Hoechst 33258 (blue), and the images were merged with a BD PathwayTM 855 Bioimager System using BD AttovisionTM software. The rectangular regions (white lines) are enlarged and shown as high-magnification insets in the right panels.
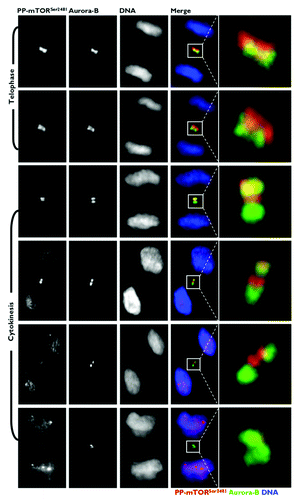
Figure 5. Co-localization analysis of phospho-mTORSer2481 and the CPP Aurora B during mitosis and cytokinesis. Asynchronously growing A431 cells were fixed and stained as described in the Materials and Methods. The figure shows representative portions of images containing dividing cells captured with a 40x objective in the channels corresponding to phospho-mTORSer2481 (red), Aurora B (green) and Hoechst 33258 (blue), and the images were merged with a BD PathwayTM 855 Bioimager System using BD AttovisionTM software. The rectangular regions (white lines) are enlarged and shown as high-magnification insets in the right panels.

Figure 5. Co-localization analysis of phospho-mTORSer2481 and the CPP Aurora B during mitosis and cytokinesis. Asynchronously growing A431 cells were fixed and stained as described in the Materials and Methods. The figure shows representative portions of images containing dividing cells captured with a 40x objective in the channels corresponding to phospho-mTORSer2481 (red), Aurora B (green) and Hoechst 33258 (blue), and the images were merged with a BD PathwayTM 855 Bioimager System using BD AttovisionTM software. The rectangular regions (white lines) are enlarged and shown as high-magnification insets in the right panels.

Figure 6. Investigation of the specificity of phospho-mTORSer2481 antibodies. Top: Schematic of mTOR protein. The region between the kinase domain (KD) and an NH2-terminal extension of the FATC domain (FATC-N) is conserved among vertebrates,Citation10 including the marked phosphorylation sites S2448 and S2481. (HEAT, Huntington, elongation factor 3, PR65/A, TOR; FAT, FRAP, ATM, TRRAP; FRB, FKBP12 rapamycin-binding; KD, kinase domain; RD, regulatory domain; FATC, FRAP ATM TRRAP carboxy-terminus.) Bottom: Characterization of the specificity of anti-phospho-mTORSer2481 antibodies. The VPESIH(S)FIGDG-blocking peptide was obtained from Abcam®. We added VPESIH(S)FIGDG to each antibody at a 2:1 (v/v) ratio in a total volume of 100 μL and then incubated this combination for a minimum of 30 min prior to adding the required volumes to the imaging tissue culture plates. Immunofluorescence analyses showed that the mitotic/cytokinetic geography of phospho-mTORSer2481 was fully blocked by peptide competition.
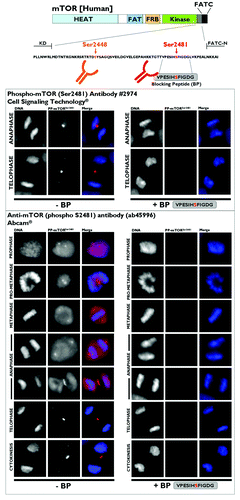
Figure 6. Investigation of the specificity of phospho-mTORSer2481 antibodies. Top: Schematic of mTOR protein. The region between the kinase domain (KD) and an NH2-terminal extension of the FATC domain (FATC-N) is conserved among vertebrates,Citation10 including the marked phosphorylation sites S2448 and S2481. (HEAT, Huntington, elongation factor 3, PR65/A, TOR; FAT, FRAP, ATM, TRRAP; FRB, FKBP12 rapamycin-binding; KD, kinase domain; RD, regulatory domain; FATC, FRAP ATM TRRAP carboxy-terminus.) Bottom: Characterization of the specificity of anti-phospho-mTORSer2481 antibodies. The VPESIH(S)FIGDG-blocking peptide was obtained from Abcam®. We added VPESIH(S)FIGDG to each antibody at a 2:1 (v/v) ratio in a total volume of 100 μL and then incubated this combination for a minimum of 30 min prior to adding the required volumes to the imaging tissue culture plates. Immunofluorescence analyses showed that the mitotic/cytokinetic geography of phospho-mTORSer2481 was fully blocked by peptide competition.

Figure 7. Mitotic dynamics of phospho-mTORSer2481 and phospho-mTORSer2448 during mitosis and cytokinesis. Asynchronously growing A431 cells were fixed and stained as described in the Materials and Methods. The figure shows representative portions of images containing dividing cells captured with a 20x objective in the channels corresponding to phospho-mTORSer2481 (red), phospho-mTORSer2448 (red), phospho-Histone H3Ser10 (green) and Hoechst 33258 (blue), and the images were merged with a BD PathwayTM 855 Bioimager System using BD AttovisionTM software. (P, prophase; PM, prometaphase; A, anaphase; M, metaphase; T, telophase; Cy, cytokinesis.)
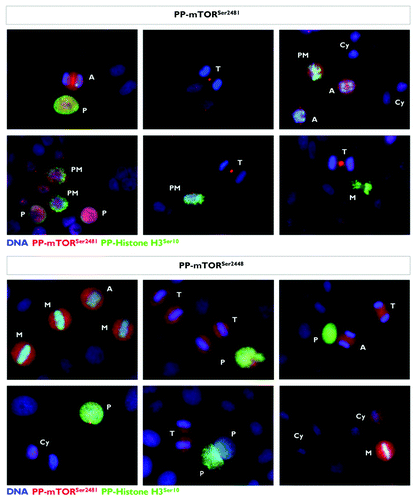
Figure 7. Mitotic dynamics of phospho-mTORSer2481 and phospho-mTORSer2448 during mitosis and cytokinesis. Asynchronously growing A431 cells were fixed and stained as described in the Materials and Methods. The figure shows representative portions of images containing dividing cells captured with a 20x objective in the channels corresponding to phospho-mTORSer2481 (red), phospho-mTORSer2448 (red), phospho-Histone H3Ser10 (green) and Hoechst 33258 (blue), and the images were merged with a BD PathwayTM 855 Bioimager System using BD AttovisionTM software. (P, prophase; PM, prometaphase; A, anaphase; M, metaphase; T, telophase; Cy, cytokinesis.)

Figure 8. Spatiotemporal relationship between phospho-mTORSer2448 and phospho-histone H3Ser10 during mitosis and cytokinesis. After fixation and permeabilization of asynchronously growing A431 cells in 96-well clear-bottom imaging tissue culture plates optimized for automated imaging applications, cells were double-stained with antibodies against phospho-mTORSer2448 and α-tubulin and with Hoechst 33258 for nuclear counterstaining. The figure shows representative portions of images containing dividing cells captured with a 40x objective in the channels corresponding to phospho-mTORSer2448 (red), phospho-histone H3Ser10 (green) and Hoechst 33258 (blue), and the images were merged with a BD Pathway™ 855 Bioimager System using BD Attovision™ software.
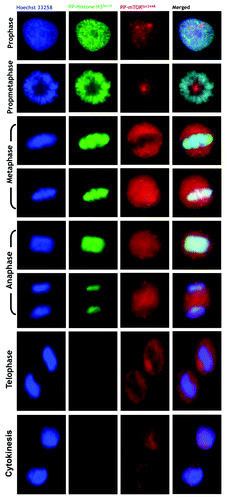
Figure 8. Spatiotemporal relationship between phospho-mTORSer2448 and phospho-histone H3Ser10 during mitosis and cytokinesis. After fixation and permeabilization of asynchronously growing A431 cells in 96-well clear-bottom imaging tissue culture plates optimized for automated imaging applications, cells were double-stained with antibodies against phospho-mTORSer2448 and α-tubulin and with Hoechst 33258 for nuclear counterstaining. The figure shows representative portions of images containing dividing cells captured with a 40x objective in the channels corresponding to phospho-mTORSer2448 (red), phospho-histone H3Ser10 (green) and Hoechst 33258 (blue), and the images were merged with a BD Pathway™ 855 Bioimager System using BD Attovision™ software.

Reprints and Corporate Permissions

Please note: Selecting permissions does not provide access to the full text of the article, please see our help page How do I view content?

To request a reprint or corporate permissions for this article, please click on the relevant link below:

Academic Permissions

Please note: Selecting permissions does not provide access to the full text of the article, please see our help page How do I view content?

Obtain permissions instantly via Rightslink by clicking on the button below:

If you are unable to obtain permissions via Rightslink, please complete and submit this Permissions form. For more information, please visit our Permissions help page.