2,871
Views
66
CrossRef citations to date
0
Altmetric
Extra Views

The mitochondrial H+-ATP synthase and the lipogenic switch

New core components of metabolic reprogramming in induced pluripotent stem (iPS) cells

, , , , , , , & show all
Pages 207-218 | Published online: 15 Jan 2012

Figures & data

Figure 1. The AMPK agonist metformin suppresses the upregulation of the ATPase inhibitory factor 1 (IF1) of the mitochondrial H+-ATPase in iPS colonies. iPS cells were maintained in an undifferentiated stage on gelatin-coated tissue culture surfaces in the presence of LIF. After 48 h of treatment with vehicle or 10 mmol/L metformin, IF1 protein levels (white staining) were analyzed by immunofluorescent confocal microscopy. DNA was counterstained with Hoechst 33258 (blue). Images are representative of five independent experiments testing two individual iPS clones. Images show also representative images of untreated and metformin-treated iPS colonies that were captured using different channels for SSEA-1 (green) or Hoechst 33258 (blue).
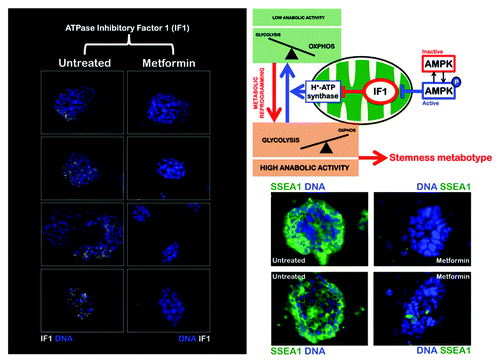
Figure 1. The AMPK agonist metformin suppresses the upregulation of the ATPase inhibitory factor 1 (IF1) of the mitochondrial H+-ATPase in iPS colonies. iPS cells were maintained in an undifferentiated stage on gelatin-coated tissue culture surfaces in the presence of LIF. After 48 h of treatment with vehicle or 10 mmol/L metformin, IF1 protein levels (white staining) were analyzed by immunofluorescent confocal microscopy. DNA was counterstained with Hoechst 33258 (blue). Images are representative of five independent experiments testing two individual iPS clones. Images show also representative images of untreated and metformin-treated iPS colonies that were captured using different channels for SSEA-1 (green) or Hoechst 33258 (blue).
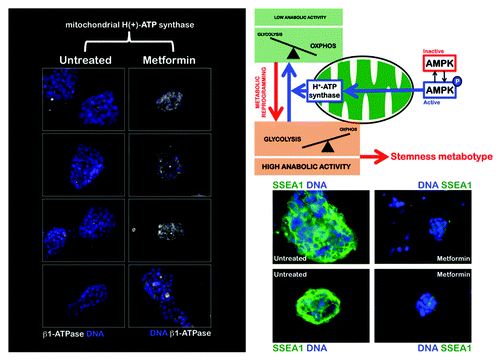
Figure 2. The AMPK agonist metformin upregulates the expression of the catalytic β-F1-ATPase subunit, the rate-limiting component of mitochondrial OXPHOS in iPS colonies. iPS cells were maintained in an undifferentiated stage on gelatin-coated tissue culture surfaces in the presence of LIF. After 48 h of treatment with vehicle or 10 mmol/L metformin, β-F1-ATPase protein levels (white staining) were analyzed by immunofluorescent confocal microscopy. DNA was counterstained with Hoechst 33258 (blue). Images are representative of five independent experiments testing two individual iPS clones. Figure also shows representative images of untreated and metformin-treated iPS colonies that were captured using different channels for SSEA-1 (green) or Hoechst 33258 (blue).

Figure 2. The AMPK agonist metformin upregulates the expression of the catalytic β-F1-ATPase subunit, the rate-limiting component of mitochondrial OXPHOS in iPS colonies. iPS cells were maintained in an undifferentiated stage on gelatin-coated tissue culture surfaces in the presence of LIF. After 48 h of treatment with vehicle or 10 mmol/L metformin, β-F1-ATPase protein levels (white staining) were analyzed by immunofluorescent confocal microscopy. DNA was counterstained with Hoechst 33258 (blue). Images are representative of five independent experiments testing two individual iPS clones. Figure also shows representative images of untreated and metformin-treated iPS colonies that were captured using different channels for SSEA-1 (green) or Hoechst 33258 (blue).

Figure 3. The AMPK agonist metformin induces mitochondrial biogenesis and elongation in MEFs. Low-passage MEFs were cultured in the absence or presence of 10 mmol/L metformin for 48 h. Mitochondrial morphology and organization was detected by transient transfection with mito-DsRed or by staining with an antibody against the β1-subunit of the mitochondrial F1-ATPase complex. Figure shows representative images of untreated or metformin-treated MEFs that were captured using different channels for mito-DsRed or β1-ATPase (white) or Hoechst 33258 (blue). Note that metformin-treated MEFs showed significantly more organized and elongated mitochondria.
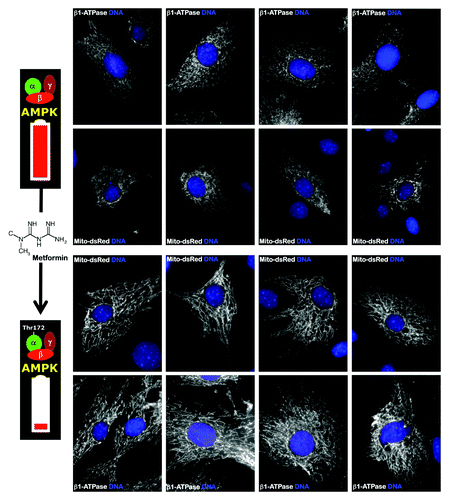
Figure 3. The AMPK agonist metformin induces mitochondrial biogenesis and elongation in MEFs. Low-passage MEFs were cultured in the absence or presence of 10 mmol/L metformin for 48 h. Mitochondrial morphology and organization was detected by transient transfection with mito-DsRed or by staining with an antibody against the β1-subunit of the mitochondrial F1-ATPase complex. Figure shows representative images of untreated or metformin-treated MEFs that were captured using different channels for mito-DsRed or β1-ATPase (white) or Hoechst 33258 (blue). Note that metformin-treated MEFs showed significantly more organized and elongated mitochondria.

Figure 4. Coordinate activation of lipogenic enzymes in iPS cells. Top: Robust and metformin-sensitive expression of the lipogenic enzymes acetyl-CoA carboxylase (ACACA) and fatty acid synthase (FASN) in iPS cells as measured by western blot (left) and immunofluorescence microscopy (right). Note that iPS cells express significantly higher levels of ACACA and FASN than MEFs. Figure shows also representative images of untreated and metformin-treated (10 mmol/L; 48 h) iPS cells that were captured using different channels for ACACA or FASN (green) or Hoechst 33258 (blue). Bottom: The intracellular accumulation of neutral lipids in iPS cells was evaluated with LipidTOX™ Green neutral lipid stain. The significant neutral lipid aggregates within iPS cells might reflect accumulation of organelles of lysosomal/autophagic origin.
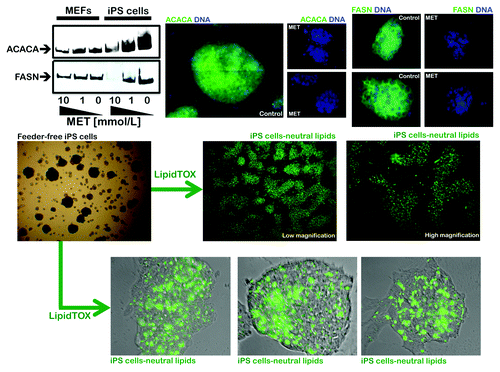
Figure 4. Coordinate activation of lipogenic enzymes in iPS cells. Top: Robust and metformin-sensitive expression of the lipogenic enzymes acetyl-CoA carboxylase (ACACA) and fatty acid synthase (FASN) in iPS cells as measured by western blot (left) and immunofluorescence microscopy (right). Note that iPS cells express significantly higher levels of ACACA and FASN than MEFs. Figure shows also representative images of untreated and metformin-treated (10 mmol/L; 48 h) iPS cells that were captured using different channels for ACACA or FASN (green) or Hoechst 33258 (blue). Bottom: The intracellular accumulation of neutral lipids in iPS cells was evaluated with LipidTOX™ Green neutral lipid stain. The significant neutral lipid aggregates within iPS cells might reflect accumulation of organelles of lysosomal/autophagic origin.

Figure 5. Pharmacological inhibition of endogenous lipogenesis decreases reprogramming efficiency. Early passage MEFs infected with retroviruses encoding Oct4, Sox2 and Klf4 (OSK) were cultured in ES medium in the continuous presence or absence of a non-cytotoxic concentration of soraphen A, C75 or DMSO alone as control, as specified. The numbers of alkaline phosphatase (AP)+ colonies (microphotographs of representative reprogramming experiments are shown) were counted 14 d after the initial infection and were plotted for each condition relative to the controls (x-fold), as specified. The error bars indicate the SEM.
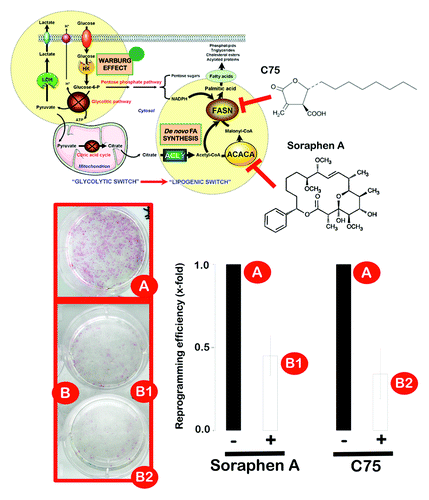
Figure 5. Pharmacological inhibition of endogenous lipogenesis decreases reprogramming efficiency. Early passage MEFs infected with retroviruses encoding Oct4, Sox2 and Klf4 (OSK) were cultured in ES medium in the continuous presence or absence of a non-cytotoxic concentration of soraphen A, C75 or DMSO alone as control, as specified. The numbers of alkaline phosphatase (AP)+ colonies (microphotographs of representative reprogramming experiments are shown) were counted 14 d after the initial infection and were plotted for each condition relative to the controls (x-fold), as specified. The error bars indicate the SEM.

Figure 6. The Warburg effect and de novo fatty acid biogenesis: Metabolic reprogramming permits repression of differentiation in iPS cells. The a priori bioenergetic-anabolic signature of somatic cells correlates with their reprogramming efficiencies and with the acquisition of stemness properties. Cells that demonstrate an active glycolysis-lipogenesis axis reprogram more quickly and efficiently than those demonstrating a metabotype closer to the oxidative/non-lipogenic state of normal, non-proliferative somatic cells. We now reveal that, similarly to cancer cells, the Warburg effect in iPS cells can be established by decreasing the activity and expression of β-F1-ATPase, a key subunit of the mitochondrial ATP synthase. Furthermore, iPS-associated metabolic reprogramming also involves an exacerbated activation of ACACA- and FASN-catalyzed de novo-fatty acid synthesis. Activation of H+-ATPase and inhibition of endogenous lipogenesis can endow somatic cells with a metabolic infrastructure protected against reprogramming.
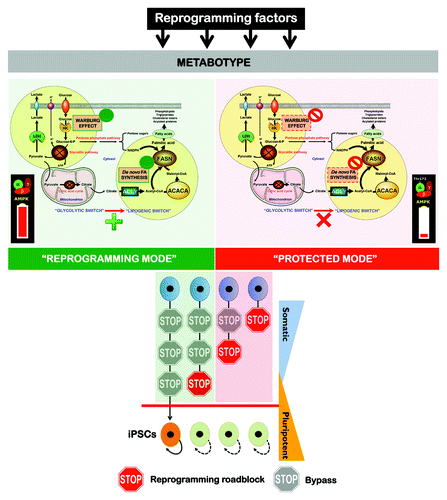
Figure 6. The Warburg effect and de novo fatty acid biogenesis: Metabolic reprogramming permits repression of differentiation in iPS cells. The a priori bioenergetic-anabolic signature of somatic cells correlates with their reprogramming efficiencies and with the acquisition of stemness properties. Cells that demonstrate an active glycolysis-lipogenesis axis reprogram more quickly and efficiently than those demonstrating a metabotype closer to the oxidative/non-lipogenic state of normal, non-proliferative somatic cells. We now reveal that, similarly to cancer cells, the Warburg effect in iPS cells can be established by decreasing the activity and expression of β-F1-ATPase, a key subunit of the mitochondrial ATP synthase. Furthermore, iPS-associated metabolic reprogramming also involves an exacerbated activation of ACACA- and FASN-catalyzed de novo-fatty acid synthesis. Activation of H+-ATPase and inhibition of endogenous lipogenesis can endow somatic cells with a metabolic infrastructure protected against reprogramming.

Reprints and Corporate Permissions

Please note: Selecting permissions does not provide access to the full text of the article, please see our help page How do I view content?

To request a reprint or corporate permissions for this article, please click on the relevant link below:

Academic Permissions

Please note: Selecting permissions does not provide access to the full text of the article, please see our help page How do I view content?

Obtain permissions instantly via Rightslink by clicking on the button below:

If you are unable to obtain permissions via Rightslink, please complete and submit this Permissions form. For more information, please visit our Permissions help page.