Figures & data
Figure 1. EWS/FLI1- and EWS siRNA-transfected HeLa cells display abnormal CPC component localizations at the midzone. (A) Immunocytochemistry: left, untransfected; middle, empty vector; right, pSG5-2xFLAG-EWS/FLI1-transfected HeLa cells using: (a) top, merged images of anti-Borealin antibody (green) and DAPI (blue): bottom: anti-Borealin antibody; (b) top, merged images of anti-INCENP antibody (red) and DAPI (blue); bottom, anti-INCENP antibody; (c) top, merged images of anti-Survivin antibody (green) and DAPI (blue); bottom, anti-Survivin antibody. (A’). The percentages of cells that displayed mislocalized CPC components (31 to 72 anaphase cells per sample) (Experiments were repeated for n = 3 for Borealin, n = 4 for INCENP, n = 3 for Survivin). (B) Immunocytochemistry: left, untransfected; middle, control-siRNA; right, EWS siRNA-transfected HeLa cells using: (a) top, merged images of anti-Borealin antibody (green) and DAPI (blue); bottom, anti-Borealin antibody; (b) top, merged images of anti-INCENP antibody (red) and DAPI (blue); bottom: anti-INCENP antibody; (c) top, merged images of anti-Survivin antibody (green) and DAPI (blue); bottom, anti-Survivin antibody. (B’) The percentages of cells that displayed mislocalized CPC components (26 to 69 anaphase cells per sample) (Experiments were repeated for n = 3 for Borealin, n = 3 for INCENP, n = 4 for Survivin). Vector, empty vector; E/F, EWS/FLI1; Cont si, control-siRNA; EWS si, EWS siRNA-transfected HeLa cells. <, area of midzone with aberrant localization of CPC components; [, area of midzone with localization of CPC components.
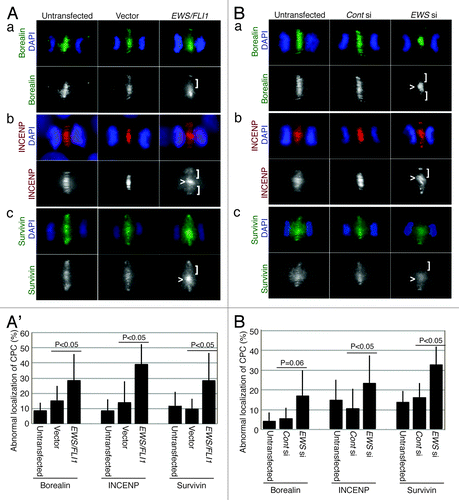
Figure 2. EWS/FLI1-expressing and EWS-knockdown HeLa cells display aberrant localizations of PRC1 at the midzone, and the transfection of Ewing sarcoma A673 cells with EWS rescues the high incidence of aberrant localization of PRC1 at the midzone. (A) Top, merged images, with DNA stained with DAPI (blue) and PRC1 (red) visualized via anti-PRC1 antibody; bottom, PRC1. Untransf., untransfected; vector, empty vector; E/F, human pSG5-2xFLAG-EWS/FLI1-transfected HeLa cells. bottom: PRC1 visualized with anti-PRC1 antibody. (B) The percentages of HeLa cells with mislocalized PRC1. The pSG5-2xFLAG-EWS/FLI-transfected HeLa cells displayed a higher incidence of abnormal PRC1 localization (31 to 72 anaphase cells per sample) (n = 3 experiments). (C) Top, merged images with DNA stained using DAPI (blue), and PRC1 (red) visualized with anti-PRC1 antibody. Untransf, untransfected; CONT si, control-siRNA; EWS si, human EWS siRNA-transfected HeLa cells. Bottom, PRC1 visualized with anti-PRC1 antibody. (D) The percentages of HeLa cells with mislocalized PRC1. The EWS siRNA-transfected HeLa cells display a higher incidence of abnormal PRC1 localization (30 to 56 anaphase were scored for each of the experiment)(n = 4 experiments). (E) Western blotting of A673 cell lysates from untransfected, empty vector-transfected and pSG5-2xFLAG-EWS-transfected cells probed with anti-FLAG antibody to verify transfection, and anti-β-actin antibody control. (F) The percentages of the cells with abnormal localization patterns for PRC1 were scored (n = 3 experiments). The transfection of Ewing sarcoma A673 cells with EWS rescues the high incidence of the aberrant localization of PRC1 at the midzone. (50 to 51 anaphase were scored for each of the experiment)(n = 4 experiments). <, area of midzone with aberrant localization of PRC1; [, area of midzone with localization of PRC1 components.
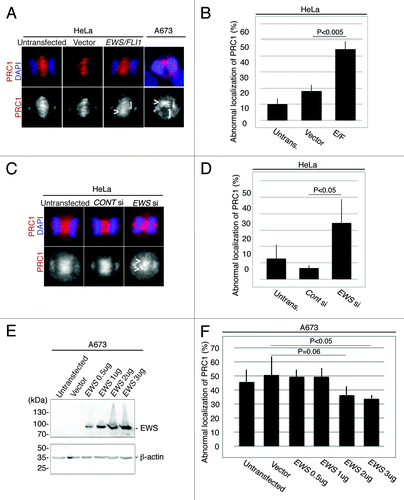
Figure 3. EWS colocalizes with Aurora B at the midzone in A673 and HeLa cells. Single Z-section images of (A) Top, merged images with DNA stained using DAPI (blue), Aurora B (red) visualized using anti-Aurora B antibody, and EWS (green) via anti-EWS antibody; middle, Aurora B visualized with anti-Aurora B antibody; bottom, EWS visualized with anti-EWS antibody in A673 cells; (B) top, merged images with DNA stained with DAPI (blue), Aurora B (red) visualized with anti-Aurora B antibody and EWS (green) with anti-EWS antibody; middle, Aurora B visualized with anti-Aurora B antibody; bottom, EWS visualized with anti-EWS antibody in HeLa cells. Higher magnification images of midzone are shown in the boxed area in anaphase images obtained from both A673 and HeLa cells (A and B).
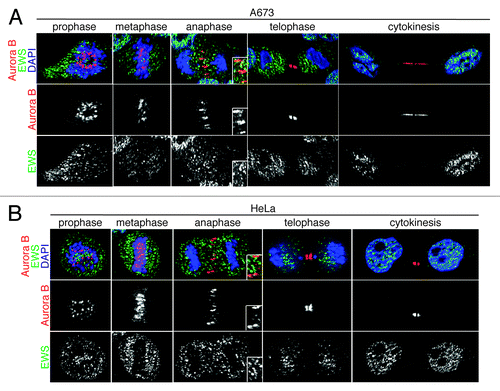
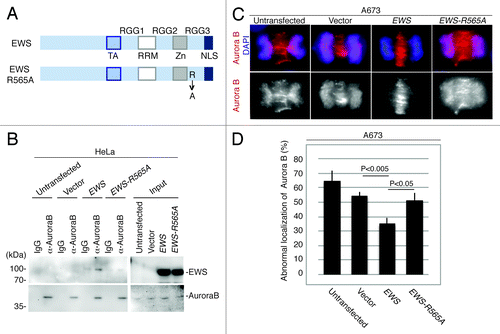
Figure 4. EWS but not EWS-R565A mutant interacts with Aurora B, and transfection with EWS but not EWS-R565A mutants rescues the high incidence of the aberrant localization of Aurora B in A673 cells. (A) Schematic drawing of EWS and EWS-R565A mutant proteins. (B) Immunoprecipitation of lysates from untransfected, empty vector, pSG5-2xFLAG-EWS- and pSG5-2xFLAG-EWS-R565A mutant-transfected HeLa cells using IgG and anti-Aurora B antibody. Top (left), probing blots with anti-FLAG shows that EWS coimmunoprecipitates with Aurora B. Bottom; left, Probing blots with anti-Aurora B shows immunoprecipitation of endogenous Aurora B; right, input sample (1/50) of cell lysates of untransfected, empty vector, pSG5-2xFLAG-EWS- and pSG5-2xFLAG-EWS-R565A-transfected HeLa cells demonstrated with anti-FLAG antibody (top) and anti-Aurora B antibody (bottom). (C) Top, merged images with DNA stained with DAPI (blue), and Aurora B (red) visualized with anti-Aurora B antibody; bottom, Aurora B visualized with anti-Aurora B antibody in A673 cells. (D) Percentages of cells with abnormal localization patterns for Aurora B were scored in untransfected, empty vector, pSG5-2xFLAG-EWS- and pSG5-2xFLAG-EWS-R565A-transfected A673 cells (50 anaphase were scored for each of the experiment) (n = 3 experiments).