595
Views
21
CrossRef citations to date
0
Altmetric
Report

A conserved G1 regulatory circuit promotes asynchronous behavior of nuclei sharing a common cytoplasm

, , , &
Pages 3795-3803 | Published online: 15 Sep 2010

Figures & data

Figure 1 G1 is variable between nuclei in the same cell. (A) Cells with GFP-localized to nuclei and SPBs visualized with mCherry were filmed using 4D fluorescence microscopy (AG290, Whi5-GFP, Tub4-mCherry). Histogram represents the distribution of times observed from birth to SPB duplication for 40 nuclei. Grey bars represent nuclei that were born but never duplicated their SPBs during the observation period and therefore ultimate G1 times are unknown but are greater than the movie length (65–100 min). The average G1 duration includes the minimal G1 lengths of these nuclei that did not transition during observation. (B) Example pedigree showing variable G1 lengths between sister nuclei. (C) Overlapping barplot of G1 times for 11 pairs of sister nuclei. The G1 time for the slow sister is in black and the G1 time for the fast sister is overlapping in grey. (D) Schematic summarizing how pairs of neighboring nuclei are considered for scoring in .
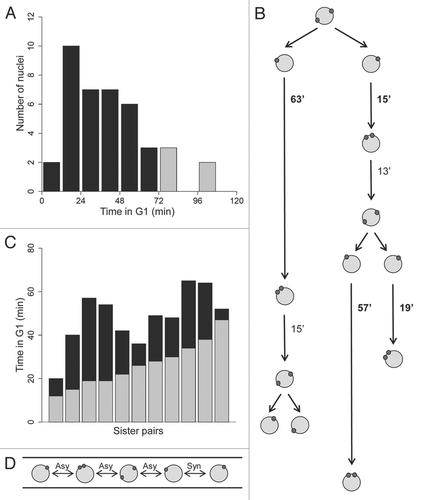
Figure 1 G1 is variable between nuclei in the same cell. (A) Cells with GFP-localized to nuclei and SPBs visualized with mCherry were filmed using 4D fluorescence microscopy (AG290, Whi5-GFP, Tub4-mCherry). Histogram represents the distribution of times observed from birth to SPB duplication for 40 nuclei. Grey bars represent nuclei that were born but never duplicated their SPBs during the observation period and therefore ultimate G1 times are unknown but are greater than the movie length (65–100 min). The average G1 duration includes the minimal G1 lengths of these nuclei that did not transition during observation. (B) Example pedigree showing variable G1 lengths between sister nuclei. (C) Overlapping barplot of G1 times for 11 pairs of sister nuclei. The G1 time for the slow sister is in black and the G1 time for the fast sister is overlapping in grey. (D) Schematic summarizing how pairs of neighboring nuclei are considered for scoring in Table 1.

Figure 2 Whi5p is nuclear in all the stages of the cell cycle. (A) A young mycelium expressing Whi5-GFP and Tub4-mCherry shows that all nuclei have Whi5-GFP (AG290). Bar, 5 µm. (B) Individual nuclei in different stages of the nuclear division cycle containing Whi5-GFP. Bar, 5 µm. (C) Images from a time series showing Whi5-GFP appears equally segregated in mitosis between sister nuclei. The nucleus undergoing mitosis is indicated by an asterisk and the resulting sister nuclei are indicated by arrowheads. Bar, 5 µm. (D) Histogram depicting the percent difference in Whi5-GFP mean fluorescence intensity between sister nuclei born from one mitosis. This difference in intensity is calculated by dividing the mean fluorescence intensity of each sister nucleus by the total intensity of the two sister nuclei and taking the absolute value of the difference between the values (n = 19 sister pairs).
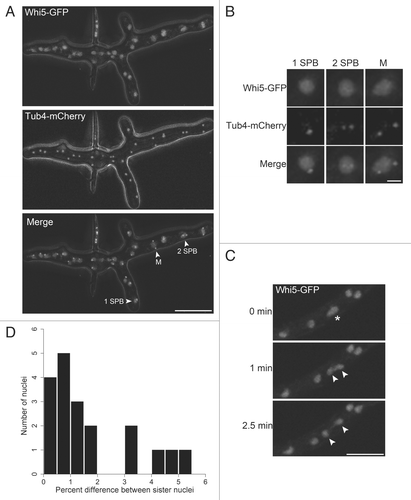
Figure 2 Whi5p is nuclear in all the stages of the cell cycle. (A) A young mycelium expressing Whi5-GFP and Tub4-mCherry shows that all nuclei have Whi5-GFP (AG290). Bar, 5 µm. (B) Individual nuclei in different stages of the nuclear division cycle containing Whi5-GFP. Bar, 5 µm. (C) Images from a time series showing Whi5-GFP appears equally segregated in mitosis between sister nuclei. The nucleus undergoing mitosis is indicated by an asterisk and the resulting sister nuclei are indicated by arrowheads. Bar, 5 µm. (D) Histogram depicting the percent difference in Whi5-GFP mean fluorescence intensity between sister nuclei born from one mitosis. This difference in intensity is calculated by dividing the mean fluorescence intensity of each sister nucleus by the total intensity of the two sister nuclei and taking the absolute value of the difference between the values (n = 19 sister pairs).

Figure 3 Model for asynchrony arising in G1. Neighboring nuclei divide asynchronously and newborn sister nuclei spend different amounts of time in G1. In mutants with altered regulation of the G1/S transition, nuclei become more synchronous.
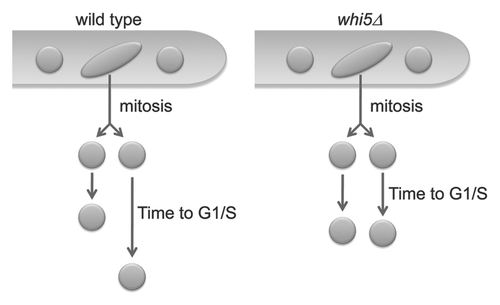
Figure 3 Model for asynchrony arising in G1. Neighboring nuclei divide asynchronously and newborn sister nuclei spend different amounts of time in G1. In mutants with altered regulation of the G1/S transition, nuclei become more synchronous.

Table 1 Observed frequency distributions of nuclear cycle stages and neighbor relations

Table 2 Synchrony index statistics

Supplemental material

Additional material

Download Zip (676.4 KB)

Reprints and Corporate Permissions

Please note: Selecting permissions does not provide access to the full text of the article, please see our help page How do I view content?

To request a reprint or corporate permissions for this article, please click on the relevant link below:

Academic Permissions

Please note: Selecting permissions does not provide access to the full text of the article, please see our help page How do I view content?

Obtain permissions instantly via Rightslink by clicking on the button below:

If you are unable to obtain permissions via Rightslink, please complete and submit this Permissions form. For more information, please visit our Permissions help page.