Figures & data
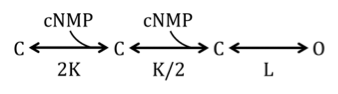
Figure 1. MMP9 increases the ligand sensitivity of CNGA3 homomeric channels. (A) Representative current traces from inside-out patches excised from Xenopus oocytes expressing homomeric human CNGA3 (A3) after activation by a sub-saturating concentration of cGMP (2 μM) for control (top) and ~10 nM MMP9-treated (bottom) patches immediately (t0, dashed line) and 60 min (t60, dark line) following excision. Current traces were elicited using voltage steps from a holding potential of 0 mV, to +80 mV, -80 mV and then returning to 0 mV. (B) Representative dose-response curves for activation of control (open symbols) and MMP9-treated (closed symbols) channels by cGMP at t0 (circles) and t60 (squares). Currents were normalized to the maximum t0 cGMP current. Continuous curves (t0, solid line; t60, hashed line) represent fits of the dose-response relationship to the Hill equation as indicated in materials and methods. Parameters for each condition shown are as follows: control, K1/2,t0 = 6.6 μM, nH = 2.9, IMAX = 1.0, K1/2,t60 = 10.3 μM, nH = 2.1, IMAX = 1.0; MMP9 K1/2,t0 = 6.4 μM, nH = 2.5, IMAX = 1.0, K1/2,t60 = 0.7 μM, nH = 1.1, IMAX = 0.8. (C) Time course for the change in cGMP apparent affinity for control (open circles) and MMP9-treated (filled circles) patches following excision. Data based on best fit Hill curves and expressed as mean K1/2 (± S.E.M.). (D) Representative current traces after activation by a saturating concentration of cGMP (1 mM, black line) or cAMP (10 mM, gray line) for control (top) and MMP9-treated (bottom) patches at 60 min following excision. (E) Time course for the change in cAMP efficacy for control (open circles) and MMP9-treated (filled circles) patches following excision. (F) Representative dose-response relationships for activation of control (open symbols) and MMP9 treated (closed symbols) A3 channels by cAMP at t0 (circles) and t80 (squares). Currents were normalized to the maximum cGMP current. Parameters of best fit Hill curves (t0, solid line; t80, hashed line) for each condition shown are as follows: control, K1/2,t0 = 1.0 mM, nH = 1.1, IMAX = 0.29, K1/2,t80 = 0.9 mM, nH = 1.0, IMAX = 0.14; MMP9 K1/2,t0 = 1.2 mM, nH = 2.2, IMAX = 0.26, K1/ 2,t80 = 0.4 mM, nH = 1.4, IMAX = 0.74. (G) Summary of change in cAMP apparent affinity for control (open circles) and MMP9-treated (filled circles) patches. (H) Families of current traces elicited by voltage steps from -100 mV to +100 mV, recorded in the presence of 1 mM cGMP, for control (top) and MMP-treated (bottom) patches at 60 min following excision. (I) Mean (± S.E.M.) current-voltage (I-V) relationships for control (open symbols) and MMP9-treated (filled symbols) patches at t0 (circles) and t60 (squares).
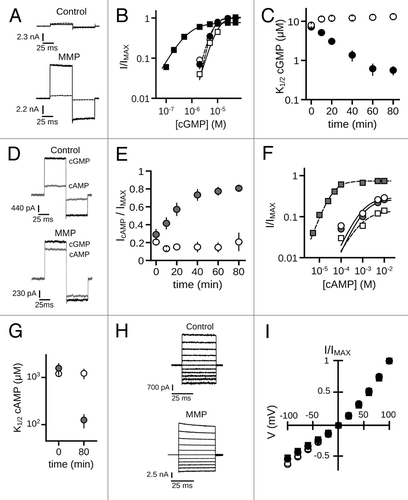
Figure 2. Single channel activity of MMP9 treated CNGA3 homomeric channels. Representative traces from an inside-out patch containing three CNG channels at cGMP concentrations of 5 µM (A), 0.5 µM (B) and 0 (C) at 5 min (t5, left column) and ~30 min (t30, right column) following excision. Currents were elicited at a membrane potential of +80 mV. C, closed channel mean current level; O, current level(s) for open channel(s). Current-amplitude histograms were amassed from 4–6 sec of recording and fit by either a single Gaussian function or the sum of multiple Gaussian functions (as indicated). The open probabilities (PO) for the different cGMP concentrations are as follows: (A) 5µM cGMP, PO,t5 = 0.11, PO,t30 = 0.43; (B) 0.5 µM cGMP, PO,t5 < 0.01, PO,t30 = 0.20 (C) 0 cGMP, PO,t5 < 0.01, PO,t30 = 0.06. The best-fit Gaussian curves produced the following unitary current (i) amplitude estimates: it5 = 2.5 pA; it30 = 3.4 pA. Scale bars: 50 msec; 5 pA.
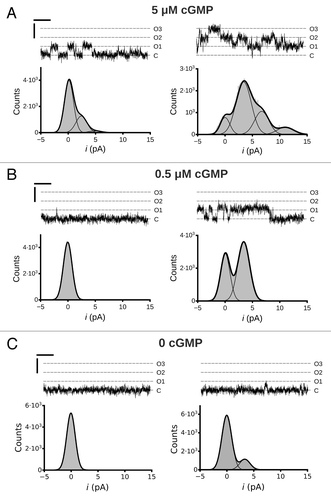
Figure 3. Inhibition of catalytic activity attenuates MMP9 induced gating effects. (A) (Left) Time course of the change in K1/2 cGMP for control (open circles) and MMP-treated patches with varying levels of calcium chelation as indicated in Materials and Methods (calcium free, squares; standard calcium, diamonds; elevated calcium, circles). (Right) Box plots summarize the K1/2, cGMP change as ratios between the initial (t0) and 20 min (t20) values (boxes represent 25th to 75th percentiles, lines represent the median, and whiskers represent the 5th to 95th percentiles). Increasing concentration of free calcium significantly enhanced the K1/2, cGMP change [single-factor ANOVA (n = 6), p < 0.0001, Holm’s t-test, *p < 0.05, ***p < 0.01]. (B) (Left) Time course of the change in cAMP efficacy for control (open circles) and MMP-treated patches with varying levels of free calcium [filled symbols, as in (A)]. (Right) Box plots summarizing the change in cAMP efficacy from the initial value at 20 min post excision. Increasing the concentration of free calcium significantly increased cAMP efficacy (p < 0.0001, single-factor ANOVA, n = 6; *p < 0.05, Holm’s t-test). (C) Box plots summarizing the change in K1/2, cGMP (Left) and the change in cAMP efficacy (Right) approximately 25 min post excision. Coapplication of a function-blocking antibody with MMP9 (MMP + Ab) or heat denaturation of MMP9 (MMP + heat) significantly reduced the effect of MMP9 on gating (p < 0.0001, single-factor ANOVA, n = 3–6; *p < 0.05, **p < 0.01, ***p < 0.001, Holm’s t-test;).
![Figure 3. Inhibition of catalytic activity attenuates MMP9 induced gating effects. (A) (Left) Time course of the change in K1/2 cGMP for control (open circles) and MMP-treated patches with varying levels of calcium chelation as indicated in Materials and Methods (calcium free, squares; standard calcium, diamonds; elevated calcium, circles). (Right) Box plots summarize the K1/2, cGMP change as ratios between the initial (t0) and 20 min (t20) values (boxes represent 25th to 75th percentiles, lines represent the median, and whiskers represent the 5th to 95th percentiles). Increasing concentration of free calcium significantly enhanced the K1/2, cGMP change [single-factor ANOVA (n = 6), p < 0.0001, Holm’s t-test, *p < 0.05, ***p < 0.01]. (B) (Left) Time course of the change in cAMP efficacy for control (open circles) and MMP-treated patches with varying levels of free calcium [filled symbols, as in (A)]. (Right) Box plots summarizing the change in cAMP efficacy from the initial value at 20 min post excision. Increasing the concentration of free calcium significantly increased cAMP efficacy (p < 0.0001, single-factor ANOVA, n = 6; *p < 0.05, Holm’s t-test). (C) Box plots summarizing the change in K1/2, cGMP (Left) and the change in cAMP efficacy (Right) approximately 25 min post excision. Coapplication of a function-blocking antibody with MMP9 (MMP + Ab) or heat denaturation of MMP9 (MMP + heat) significantly reduced the effect of MMP9 on gating (p < 0.0001, single-factor ANOVA, n = 3–6; *p < 0.05, **p < 0.01, ***p < 0.001, Holm’s t-test;).](/cms/asset/78c0206e-16af-40ea-811e-a5576f122d1c/kchl_a_10920904_f0003.gif)
Figure 4. Disruption of the actin cytoskeleton or of integrin mediated cell adhesion does not prevent MMP9 induced gating effects. (A) Box plots summarizing the change in K1/2, cGMP (Left) and the change in cAMP efficacy (Right) approximately 25 min post excision. Neither the integrin adhesion peptide antagonist GRGDSP (MMP+RGD), nor disruption of the actin cytoskeleton by cytochalasin D, significantly altered the change in K1/2, cGMP or in cAMP efficacy induced by MMP9 (p > 0.1, single-factor ANOVA analysis performed among MMP9-treatment conditions, n = 4–7). (B) Representative dose-response curves for activation of control (open squares), and protease treated (filled symbols) A3 channels by cGMP at t40 (Left). Currents were normalized to the maximum t40 cGMP current. Parameters of best fit Hill curves for each condition shown are as follows: control, K1/2 = 8.0 μM, nH = 2.3; MMP9 (filled squares), K1/2 = 0.4 μM, nH = 1.3; MMP2 (filled diamonds), K1/2 = 0.5 μM, nH = 1.2; trypsin (filled triangles), K1/2 = 10.0 μM, nH = 1.9; collagenase (filled circles), K1/2 = 8.6 μM, nH = 2.3. Box plots summarizing the change in K1/2, cGMP approximately 40 min post excision (Right). MMP2 (10 nM) produced gating effects indistinguishable from MMP9 (10 nM). Application of either trypsin (10 nM) or collagenase (100 nM) failed to produce similar gating effects
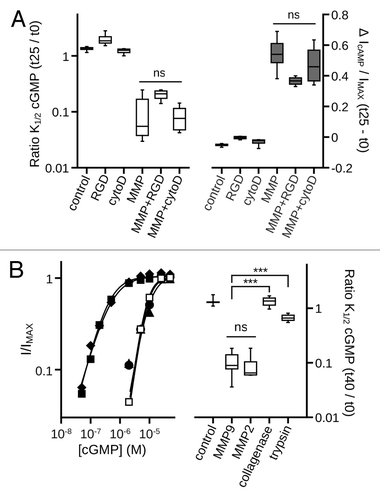
Figure 5. MMP9 directed gating effects are influenced by channel state. (A) (Left) Time course of the change in K1/2, cGMP for control (open circles) and MMP-treated patches exposed to varying concentrations of cGMP to influence channel state: open (1 mM cGMP), squares; closed (zero cGMP), circles; sub-saturating cGMP (graded, 0.2–2 µM), diamonds. (Right) Box plots summarize the K1/2, cGMP change as ratios between the initial (t0) and 20 min (t20) values. Exposure to cGMP significantly impacted the MMP9 induced K1/2, cGMP change (p < 0.0001, single-factor ANOVA, n = 4–5). Individual comparisons demonstrate that maintaining channels in the open state significantly attenuated the K1/2, cGMP change, whereas exposure to sub-saturating cGMP significantly enhanced the K1/2 change compared with the closed state (**p < 0.01, Holm’s t-test, n = 4–5). (B) (Left) Time course of the change in cAMP efficacy for control (open circles) and MMP9-treated patches exposed to varying levels of cGMP [filled symbols, as in (A)]. (Right) Box plots summarize the change in cAMP efficacy at 10 min post excision compared with the initial value. Exposure to cGMP significantly impacted the change in cAMP efficacy (p < 0.01, single-factor ANOVA, n = 4–5). The efficacy of cAMP was significantly elevated after 10 min for patches exposed to sub-saturating cGMP (*p < 0.05, Holm’s t-test, n = 4–5).
![Figure 5. MMP9 directed gating effects are influenced by channel state. (A) (Left) Time course of the change in K1/2, cGMP for control (open circles) and MMP-treated patches exposed to varying concentrations of cGMP to influence channel state: open (1 mM cGMP), squares; closed (zero cGMP), circles; sub-saturating cGMP (graded, 0.2–2 µM), diamonds. (Right) Box plots summarize the K1/2, cGMP change as ratios between the initial (t0) and 20 min (t20) values. Exposure to cGMP significantly impacted the MMP9 induced K1/2, cGMP change (p < 0.0001, single-factor ANOVA, n = 4–5). Individual comparisons demonstrate that maintaining channels in the open state significantly attenuated the K1/2, cGMP change, whereas exposure to sub-saturating cGMP significantly enhanced the K1/2 change compared with the closed state (**p < 0.01, Holm’s t-test, n = 4–5). (B) (Left) Time course of the change in cAMP efficacy for control (open circles) and MMP9-treated patches exposed to varying levels of cGMP [filled symbols, as in (A)]. (Right) Box plots summarize the change in cAMP efficacy at 10 min post excision compared with the initial value. Exposure to cGMP significantly impacted the change in cAMP efficacy (p < 0.01, single-factor ANOVA, n = 4–5). The efficacy of cAMP was significantly elevated after 10 min for patches exposed to sub-saturating cGMP (*p < 0.05, Holm’s t-test, n = 4–5).](/cms/asset/0a6e1c58-db9a-41d4-a3a9-bc9f6a51dd5d/kchl_a_10920904_f0005.gif)
Figure 6. Rate of ligand-sensitivity change is sensitive to channel density. (A) Representative time course demonstrating the change of current in the presence of a sub-saturating concentration of cGMP (2 μM) for control (open diamonds) and 10 nM MMP9 treated (filled diamonds) patches immediately following excision. The 2 μM current was normalized to the saturating cGMP current (IMAX). Shaded area highlights the linear phase of the gating change. (B) Scatter plot of the linear phases of representative time courses with varying channel densities for patches treated with MMP9. Data expressed as the change in the 2 μM current density (ΔIρ). Approximate channel densities for each time course (listed on right) were calculated with membrane patch area estimates.Citation84 Gray lines represent linear fits, with the following best-fit slopes: (in ascending order, pA•(μm2 • sec)−1) 0.0046, 0.043, 0.12, 0.30 and 0.33. (C) Best-fit slopes were plotted against the estimated channel densities for MMP9 treated patches and fit with the Michaelis-Menten equation with the following best-fit parameters and 95% confidence intervals: KM = 177 ± 26 channels; VMAX = 0.5 ± 0.03 pA•(μm2 • sec)−1.
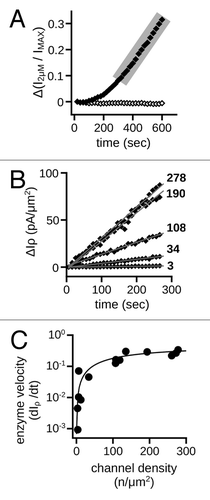
Figure 7. Application of MMP2 and -9 promotes proteolysis of CNGA3 subunits. Western blot analysis is shown for protein lysates from oocytes expressing FLAG-CNGA3 subunits. Intact oocytes were treated with MMP2 and -9 (100 μg/mL total) for 1 h; protein immunoreactivity was assessed using anti-FLAG antibody. MMP9/2 exposure caused a decrease in the bands associated with the full-length CNGA3 subunit (dark arrow) and a corresponding increase in a lower molecular weight form (gray arrow). The blot image was divided into two sections; the upper section had a shorter film-exposure time than the lower section.
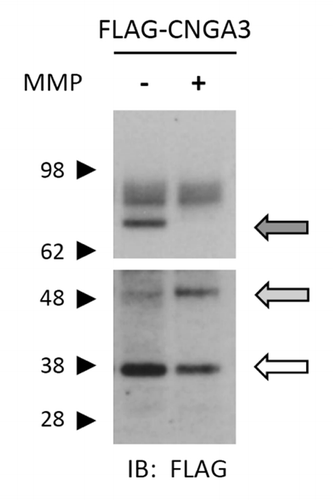
Figure 8. MMP9 increases the ligand sensitivity of heteromeric CNGA3 + CNGB3 channels. (A) Representative dose-response curves for activation of control (open symbols) and MMP9 treated (closed symbols) A3+B3 channels by cGMP at t0 (circles) and t80 (squares). Currents were normalized to the maximum t0 cGMP current. Shaded area represents approximate physiological cGMP concentration in photoreceptors in the dark.Citation47 Although prolonged MMP exposure decreases the maximum current in the presence of cGMP (IMAX), channel activation by an approximately physiological concentrations of cGMP is enhanced for MMP-treated patches. Parameters of best fit Hill curves (t0, hashed line, t80; solid line) for each condition shown are as follows: control, K1/2,t0 = 15.7 μM, nH = 2.1, IMAX = 1.0; K1/2,t80 = 16.5 μM, nH = 1.9, IMAX = 0.94; MMP9, K1/2,t0 = 15.2 μM, nH = 2.2, IMAX = 1.0; K1/2,t80 = 3.6 μM, nH = 0.8, IMAX = 0.75. (B) Time course for the change in cGMP apparent affinity for control (open circles) and MMP9-treated (filled circles) patches following excision. (C) Representative current traces after activation by a sub-saturating concentration of cGMP (2 μM) for control (top) and MMP9-treated (bottom) patches immediately (t0) and 80 min (t80) following excision. (D) Time course of the 2 μM current for control (open diamonds) and MMP9 treated (filled diamonds) patches following excision. Current normalized to maximal cGMP current (IMAX). (E) (left) Representative time course for current deactivation following removal of a saturating concentration of cGMP (1 mM; black bar) for an MMP treated patch within 5 min (open circles) and approximately 40 min following excision (t40; filled circles). Both groups were normalized to their maximum cGMP current and fit with a single exponential-decay function (black lines) with the following best-fit time constants: τt5 = 5.1 sec; τt4o = 11.2 sec. The use of a double-exponential function produced a significantly better fit than the single exponential for the t40 group (gray line; p < 0.001, extra sum-of-squares F-test) with the following decay constants: τfast = 6.2 sec; τslow = 48.5 sec. Box plots summarizing the change in the persistent current (no cNMP) within 40 min of excision for MMP-treated and control patches (right). Persistent currents were normalized to the maximum cGMP elicited current for each time point. Treatment with MMP9 produced an increase in the persistent current (*p < 0.05, Student's t-test, n = 6).
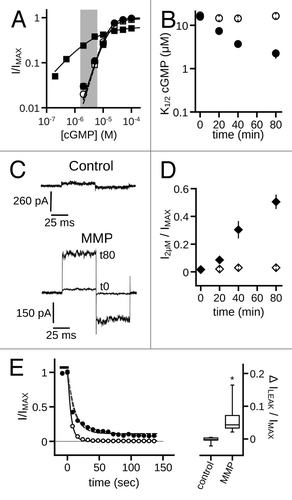
Figure 9. MMP9 increases the ligand sensitivity of rod homomeric CNGA1 and heteromeric CNGA1 + CNGB1 channels. (A) Representative dose-response curves for activation of control (open symbols) and MMP9 treated (closed symbols) A1 channels by cGMP at t0 (circles) and t40 (squares). Currents were normalized to the maximum t0 cGMP current. Parameters of best fit Hill curves (t0, hashed line; t40, solid line) for each condition shown are as follows: control, K1/2,t0 = 75.9 μM, nH = 2.2, IMAX = 1.0, K1/2,t40 = 43.9 μM, nH = 2.2, IMAX = 1.0; MMP9 K1/2,t0 = 75.3 μM, nH = 1.8, IMAX = 1.0, K1/2,t40 = 1.5 μM, nH = 0.9, IMAX = 0.50. (B) Time course for the change in cGMP apparent affinity of A1 channels for control (open circles) and MMP9-treated (filled circles) patches following excision. (C) Representative cGMP dose-response curves of control (open symbols) and MMP9 treated (closed symbols) A1+B1 channels at t0 (circles) and t40 (squares). Currents were normalized to the maximum t0 cGMP current. Parameters of best fit Hill curves (t0, hashed line; t40, solid line) for each condition shown are as follows: control, K1/2,t0 = 59.4 μM, nH = 2.3, IMAX = 1.0, K1/2,t40 = 55.6 μM, nH = 2.4, IMAX = 0.75; MMP9 K1/2,t0 = 57.2 μM, nH = 2.3, IMAX = 1.0, K1/2,t40 = 3.9 μM, nH = 1.5, IMAX = 0.53. (D) Time course for the change in cGMP apparent affinity of A1+B1 channels for control (open circles) and MMP9-treated (filled circles) patches following excision.
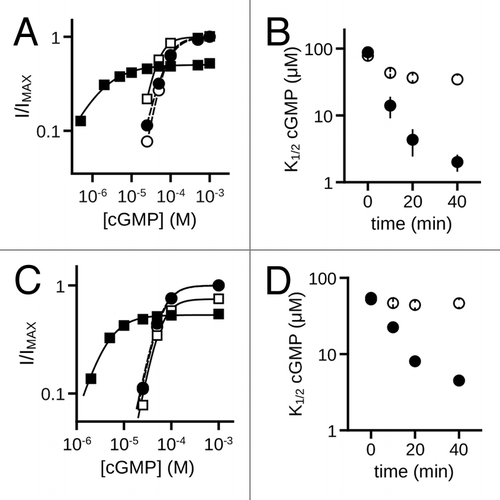
Figure 10. MMP9 induced gating effects are more pronounced for homomeric compared with heteromeric rod and cone CNG channels. (A) Representative dose-response curves for activation of control (open symbols) and MMP9-treated (closed symbols) A3 homomeric (diamonds) and A3+B3 heteromeric (triangles) channels by cGMP, at 80 min post excision. Currents were normalized to the maximum cGMP current. Continuous curves (A3, solid line; A3+B3, hashed line) represent fits with the allosteric model described in Materials and Methods. The best fit equilibrium constants for the allosteric transition (L) for each condition shown are as follows: A3control = 180, A3MMP = 217000; A3+B3control = 90, A3+B3MMP = 1700. (B) Representative dose-response curves for activation of control (open symbols) and MMP9-treated (closed symbols) A1 homomeric (diamonds) and A1+B1 heteromeric (triangles) channels by cGMP at 40 min post excision. Currents were normalized to the maximum cGMP current. Continuous curves (A1, solid line; A1+B1, hashed line) represent fits with the allosteric model used in (A). The best fits of L for each condition are as follows: A1control = 40, A1MMP = 5400; A1+B1control = 20, A1+B1MMP = 1700. (C) Bar graph showing the change in free energy difference of the allosteric transition associated with the maximal MMP9 induced gating effects for rod and cone homomeric and heteromeric channels; data expressed as mean (± S.E.M.). The change in free energy difference for channel gating was significantly reduced for heteromeric channels compared with homomeric channels [p < 0.001, 2-factor ANOVA, (channel type)] X (subunit heterogeneity), independent effect of (subunit heterogeneity), n = 3–7].
![Figure 10. MMP9 induced gating effects are more pronounced for homomeric compared with heteromeric rod and cone CNG channels. (A) Representative dose-response curves for activation of control (open symbols) and MMP9-treated (closed symbols) A3 homomeric (diamonds) and A3+B3 heteromeric (triangles) channels by cGMP, at 80 min post excision. Currents were normalized to the maximum cGMP current. Continuous curves (A3, solid line; A3+B3, hashed line) represent fits with the allosteric model described in Materials and Methods. The best fit equilibrium constants for the allosteric transition (L) for each condition shown are as follows: A3control = 180, A3MMP = 217000; A3+B3control = 90, A3+B3MMP = 1700. (B) Representative dose-response curves for activation of control (open symbols) and MMP9-treated (closed symbols) A1 homomeric (diamonds) and A1+B1 heteromeric (triangles) channels by cGMP at 40 min post excision. Currents were normalized to the maximum cGMP current. Continuous curves (A1, solid line; A1+B1, hashed line) represent fits with the allosteric model used in (A). The best fits of L for each condition are as follows: A1control = 40, A1MMP = 5400; A1+B1control = 20, A1+B1MMP = 1700. (C) Bar graph showing the change in free energy difference of the allosteric transition associated with the maximal MMP9 induced gating effects for rod and cone homomeric and heteromeric channels; data expressed as mean (± S.E.M.). The change in free energy difference for channel gating was significantly reduced for heteromeric channels compared with homomeric channels [p < 0.001, 2-factor ANOVA, (channel type)] X (subunit heterogeneity), independent effect of (subunit heterogeneity), n = 3–7].](/cms/asset/79ed863f-5224-4588-b21b-8f7a15707261/kchl_a_10920904_f0010.gif)
Figure 11. MMPs enhance the ligand sensitivity and apparent proteolysis of native rod photoreceptor CNG channels. (A) MMP9 (10 nM) was applied to the extracellular face of inside-out patches excised from Xenopus rod outer segments. Representative dose-response curves are shown for activation of control (open symbols) and MMP9-treated (closed symbols) rod CNG channels by cGMP at t0 (circles) and t25 (squares). Currents were normalized to the maximum t0 cGMP current. Parameters of best fit Hill curves (t0, hashed line; t25, solid line) for each condition shown are as follows: control, K1/2,t0 = 19.3 μM, nH = 2.6, IMAX = 1.0, K1/2,t25 = 28.1 μM, nH = 2.6, IMAX = 0.70; MMP9, K1/2,t0 = 22.8 μM, nH = 2.0, IMAX = 1.0, K1/2,t25 = 4.9 μM, nH = 1.3, IMAX = 0.41. (B) Representative current traces after activation by a saturating concentration of cGMP (1 mM, black line) or cAMP (10 mM, gray line) for control (top) and MMP9-treated (bottom) patches at approximately 25 min following excision. (C) Box plots summarizing the change in K1/2 cGMP (Left) and the change in cAMP efficacy (Right) approximately 25 min post excision. Exposure to MMP9 significantly reduced the K1/2 cGMP and enhanced the efficacy of cAMP relative to controls (**p < 0.01, Student’s t-test, n = 3). (D) Application of MMP2 and -9 promotes proteolysis of native rod CNGA1 subunits in a pattern that mimics existing in vivo proteolytic processing. Western blot analysis is shown of detergent-soluble protein homogenates from mouse retina of “young” (Y, 2–3 mo old) and “old” (O, 12–14 mo old) C57BL6 mice. Intact retinal tissues were treated with MMP2 and -9 (~10 μg/mL total) for 1 h; protein immunoreactivity was assessed using anti-CNGA1 1D1 antibody or anti-MMP9 antibody. Channel subunit proteolytic band patterns differ between young and old mice in the absence of exogenous MMP application. (E) Analysis of MMP9 in these retinas demonstrated elevated levels of a ~65 kDa active form of MMP9 in the old retinas compared with young retinas. (F) MMP9/2 exposure was associated with only a slight increase in the apparent ~50 kDa CNGA1 proteolytic band in the detergent soluble fraction (Left); however, MMP exposure led to a significant increase in the apparent ~30 kDa band in the urea-soluble retinal fraction (Right). This is also a constitutive band (present in tissues not exposed to exogenous MMPs) in both young and old detergent-soluble retinal fractions (F, light gray arrow), and is visible with longer film exposures in the urea-soluble fractions (data not shown).
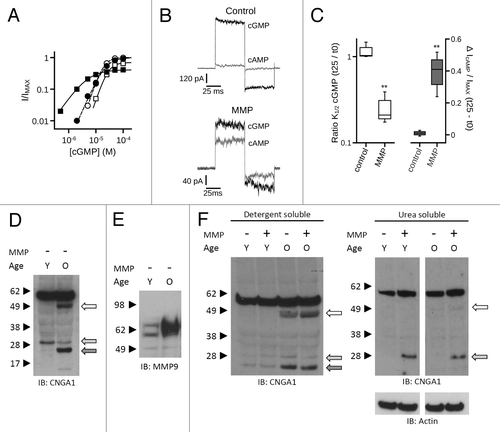
Figure 12. Allosteric model.