2,854
Views
56
CrossRef citations to date
0
Altmetric
Research Paper

Analysis of active chromatin modifications in early mammalian embryos reveals uncoupling of H2A.Z acetylation and H3K36 trimethylation from embryonic genome activation

, , , , &
Pages 747-757 | Published online: 01 Jul 2012

Figures & data

Figure 1. Dynamics of H2A.Z during mouse pre-implantation development. Freshly collected embryos were fixed and stained with an a-H2A.Z antibody (red). DNA is shown in blue. (A) Top and middle panels show full projections of Z-sections taken every 1 µm on a confocal microscope. The bottom panel shows a merge of the corresponding middle sections (1 µm) for the blue (DNA) and red (H2A.Z) channels. The arrowheads point to the polar body; male and female pronuclei are indicated; in the blastocyst image the arrow points to mitotic chromosomes. Images were acquired using the same confocal parameters and on the same slide, therefore the fluorescence levels are directly comparable. At least 8 embryos per stage were analyzed in at least two independent experiments. Scale bar = 20 µm. (B) H2A.Z levels decrease between the zygote and the 2-cell stage, after which they increase from the 4-cell stage onwards. Shown are higher magnification of pronuclei (at zygotic stage) and individual nuclei at indicated stages of development stained with a-H2A.Z antibody. Top panels show a single confocal section of H2A.Z staining (in gray scale). The bottom panels show a merge image of the corresponding Z-section of DNA (blue) and H2A.Z (red). Scale bar = 10 µm.(C) H2A.Z is absent from embryonic chromatin in the period that follows fertilization and until the second replication site at the late 2-cell stage. Early and late 2-cell stage embryos were stained with the H2A.Z antibody and analyzed under confocal microscopy under the same conditions and in parallel.
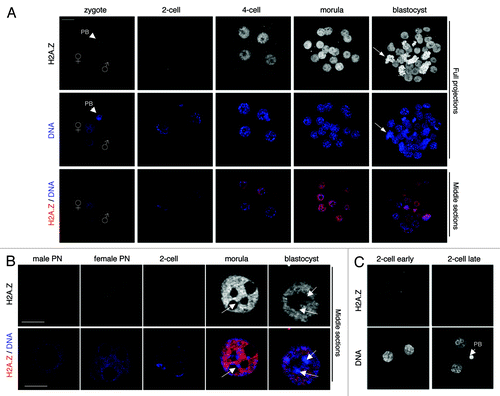
Figure 1. Dynamics of H2A.Z during mouse pre-implantation development. Freshly collected embryos were fixed and stained with an a-H2A.Z antibody (red). DNA is shown in blue. (A) Top and middle panels show full projections of Z-sections taken every 1 µm on a confocal microscope. The bottom panel shows a merge of the corresponding middle sections (1 µm) for the blue (DNA) and red (H2A.Z) channels. The arrowheads point to the polar body; male and female pronuclei are indicated; in the blastocyst image the arrow points to mitotic chromosomes. Images were acquired using the same confocal parameters and on the same slide, therefore the fluorescence levels are directly comparable. At least 8 embryos per stage were analyzed in at least two independent experiments. Scale bar = 20 µm. (B) H2A.Z levels decrease between the zygote and the 2-cell stage, after which they increase from the 4-cell stage onwards. Shown are higher magnification of pronuclei (at zygotic stage) and individual nuclei at indicated stages of development stained with a-H2A.Z antibody. Top panels show a single confocal section of H2A.Z staining (in gray scale). The bottom panels show a merge image of the corresponding Z-section of DNA (blue) and H2A.Z (red). Scale bar = 10 µm.(C) H2A.Z is absent from embryonic chromatin in the period that follows fertilization and until the second replication site at the late 2-cell stage. Early and late 2-cell stage embryos were stained with the H2A.Z antibody and analyzed under confocal microscopy under the same conditions and in parallel.

Figure 2. H2A.Z is acetylated during pre-implantation development. (A) Embryos were fixed at the indicated stages and processed for immunostaining with an antibody specific for acetylated H2A.Z (green). DNA is shown in blue. Images were acquired using confocal microscopy. Top and middle panels show full projections of Z-sections taken every 1 µm of representative embryos stained with the H2A.Zac antibody and DAPI, respectively. The bottom panel shows the merge of corresponding middle sections in the blue (DNA) and green (H2A.Zac) channels. Changes of fluorescence between cleavage stages are comparable as all embryos shown were processed in parallel and using identical acquisition settings. Scale bar = 20 µm. (B) Levels of acetylation of H2A.Z change during the course of pre-implantation development. H2A.Z acetylation is very low in both pronuclei in the zygote and becomes undetectable at the early 2-cell stage. H2A.Zac is present in euchromatic regions of morula and blastocyst stage nuclei. Full projections of nuclei stained with the H2A.Zac antibody (top) and a middle, merge section (bottom) are shown. Scale bar = 10 µm. (C) H2A.Z acetylation is not detected on mitotic chromosomes. Shown is a full projection of a morula stage blastomere stained with the H2A.Zac antibody. DNA is shown in blue.
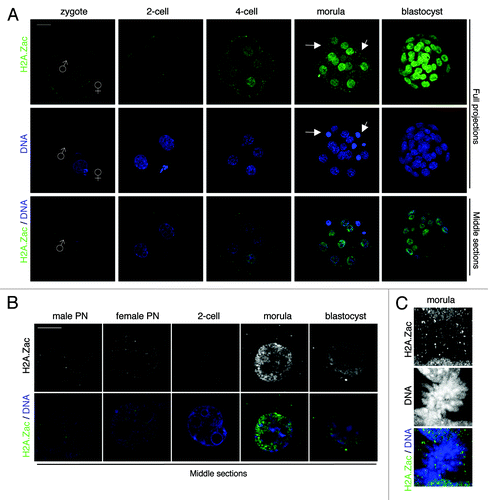
Figure 2. H2A.Z is acetylated during pre-implantation development. (A) Embryos were fixed at the indicated stages and processed for immunostaining with an antibody specific for acetylated H2A.Z (green). DNA is shown in blue. Images were acquired using confocal microscopy. Top and middle panels show full projections of Z-sections taken every 1 µm of representative embryos stained with the H2A.Zac antibody and DAPI, respectively. The bottom panel shows the merge of corresponding middle sections in the blue (DNA) and green (H2A.Zac) channels. Changes of fluorescence between cleavage stages are comparable as all embryos shown were processed in parallel and using identical acquisition settings. Scale bar = 20 µm. (B) Levels of acetylation of H2A.Z change during the course of pre-implantation development. H2A.Z acetylation is very low in both pronuclei in the zygote and becomes undetectable at the early 2-cell stage. H2A.Zac is present in euchromatic regions of morula and blastocyst stage nuclei. Full projections of nuclei stained with the H2A.Zac antibody (top) and a middle, merge section (bottom) are shown. Scale bar = 10 µm. (C) H2A.Z acetylation is not detected on mitotic chromosomes. Shown is a full projection of a morula stage blastomere stained with the H2A.Zac antibody. DNA is shown in blue.

Figure 3. H3K9ac dynamics throughout early mouse embryogenesis. (A) Acetylation of H3K9 occurs throughout pre-implantation development. Mouse embryos at the indicated stages were stained with a H3K9ac antibody (green) and with DAPI (blue). Full projections of Z-sections acquired every 1 μm (top and middle panels) and middle, merge section (bottom panel) are shown. (B) Distribution of H3K9ac in male and female pronuclei. Representative male (right) and female (left) pronuclei (PN) in zygotes at indicated pronuclear stages were stained with an H3K9ac antibody. Note that H3K9ac accumulates uniformly in both pronuclei. Scale bar = 10 µm.
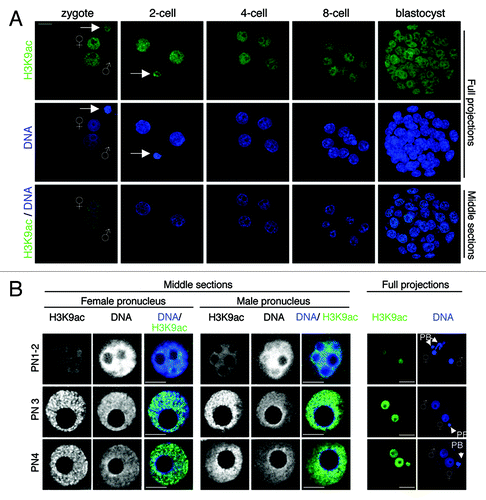
Figure 3. H3K9ac dynamics throughout early mouse embryogenesis. (A) Acetylation of H3K9 occurs throughout pre-implantation development. Mouse embryos at the indicated stages were stained with a H3K9ac antibody (green) and with DAPI (blue). Full projections of Z-sections acquired every 1 μm (top and middle panels) and middle, merge section (bottom panel) are shown. (B) Distribution of H3K9ac in male and female pronuclei. Representative male (right) and female (left) pronuclei (PN) in zygotes at indicated pronuclear stages were stained with an H3K9ac antibody. Note that H3K9ac accumulates uniformly in both pronuclei. Scale bar = 10 µm.

Figure 4. H3K36me3 shows a heterogeneous pattern in early mouse embryos. (A) H3K36me3 shows an epigenetic asymmetry between the maternal and paternal pronucleus immediately after fertilization and is undetectable at the 2-cell stage. Embryos at the indicated stages were fixed for immunostaining with an H3K36me3 antibody. Shown are full projections (top and middle panels) or single merge sections of representative embryos. (B) Distribution of H3K36me3 in parental pronuclei at zygotic stage. Male and female pronuclei at indicated stages of zygotic development were stained with an H3K36me3 antibody. H3K36me3 is readily detectable in maternal chromatin and the polar body, but undetectable in the male pronuclei. Clearly, H3K36me3 defines an epigenetic parental asymmetry and is absent from the paternal chromatin. Scale bar = 10 µm.
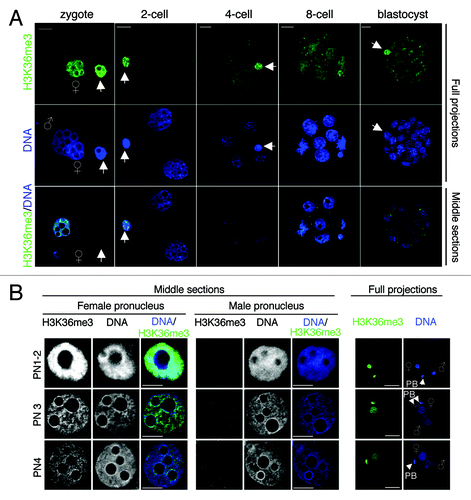
Figure 4. H3K36me3 shows a heterogeneous pattern in early mouse embryos. (A) H3K36me3 shows an epigenetic asymmetry between the maternal and paternal pronucleus immediately after fertilization and is undetectable at the 2-cell stage. Embryos at the indicated stages were fixed for immunostaining with an H3K36me3 antibody. Shown are full projections (top and middle panels) or single merge sections of representative embryos. (B) Distribution of H3K36me3 in parental pronuclei at zygotic stage. Male and female pronuclei at indicated stages of zygotic development were stained with an H3K36me3 antibody. H3K36me3 is readily detectable in maternal chromatin and the polar body, but undetectable in the male pronuclei. Clearly, H3K36me3 defines an epigenetic parental asymmetry and is absent from the paternal chromatin. Scale bar = 10 µm.

Figure 5. H3K4me3 is present throughout mouse pre-implantation development. (A) Freshly collected mouse embryos from natural matings at the indicated stages were stained with a H3K4me3 antibody (green) and with DAPI (blue). Full projections of Z-sections acquired every 1 μm (top and middle panels) and middle, merge section (bottom panel) are shown. Note that similar results were obtained with embryos derived from superovulation experiments (not shown). (B) H3K4me3 displays euchromatic localization in embryonic nuclei. Shown are higher magnifications of pronuclei (at zygotic stage) and individual nuclei at indicated stages of development stained with an H3K4me3 antibody. Top panels show a single confocal section of H2A.Z staining (in gray scale). The bottom panels show a merge image of the corresponding Z-section of DNA (blue) and H3K4me3 (green). Scale bar = 10 µm.
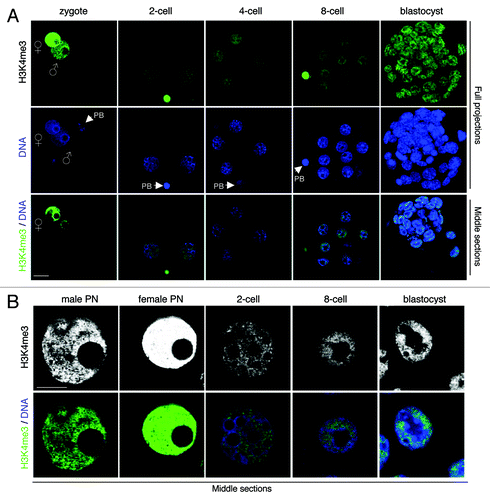
Figure 5. H3K4me3 is present throughout mouse pre-implantation development. (A) Freshly collected mouse embryos from natural matings at the indicated stages were stained with a H3K4me3 antibody (green) and with DAPI (blue). Full projections of Z-sections acquired every 1 μm (top and middle panels) and middle, merge section (bottom panel) are shown. Note that similar results were obtained with embryos derived from superovulation experiments (not shown). (B) H3K4me3 displays euchromatic localization in embryonic nuclei. Shown are higher magnifications of pronuclei (at zygotic stage) and individual nuclei at indicated stages of development stained with an H3K4me3 antibody. Top panels show a single confocal section of H2A.Z staining (in gray scale). The bottom panels show a merge image of the corresponding Z-section of DNA (blue) and H3K4me3 (green). Scale bar = 10 µm.

Figure 6. Developmental dynamics of H2A.Zac, H3K36me3 and H3K9ac in bovine embryos. (A) Analysis of H2A.Z acetylation in cleavage stage bovine embryos. H2A.Z is acetylated in the zygote and throughout pre-implantation development. Note that in bovine embryos H2A.Zac defines a parental epigenetic asymmetry as only the female PN contains acetylated H2A.Z. The number of embryos analyzed was: 32 zygotes, 24 8-cell stage embryos and 21 blastocysts. Scale bar is 5µm. (B) H2A.Z marks exclusively the maternal chromatin in bovine zygotes. Co-staining of H2A.Zac and H3K9me3 in bovine zygotes. Zygotes (n = 32) were analyzed by confocal microscopy as above. (C) H3K36me3 shows a heterogeneous distribution in bovine pre-implantation embryos. H3K36me3 is undetectable in bovine zygotes after fertilization. H3K36 methylation occurs only in few nuclei in 4-cell stage embryos and blastocysts. A total of 45 zygotes, 21 2-cell stage embryos, 16 4-cell stage embryos and 18 blastocysts were analyzed. Scale bar is 5µm. (D) H3K36me3 marks the female pronucleus exclusively at the earliest stages of bovine development immediately after fertilization. Early zygotes (17h post-fertilization) were processed for immunostaining with the H2A.Zac and the H3K36me3 antibody. Out of 20 embryos analyzed, 8 zygotes had H3K36me3 staining, which co-localized with H2AZac on the female PN. (E) H3K9ac is present throughout bovine pre-implantation development. Embryos were analyzed as above with an H3K9ac antibody. H3K9ac marks equally well both pronuclei. Note that the 2-cell stage is a very transient stage and therefore it is not included in our figure.
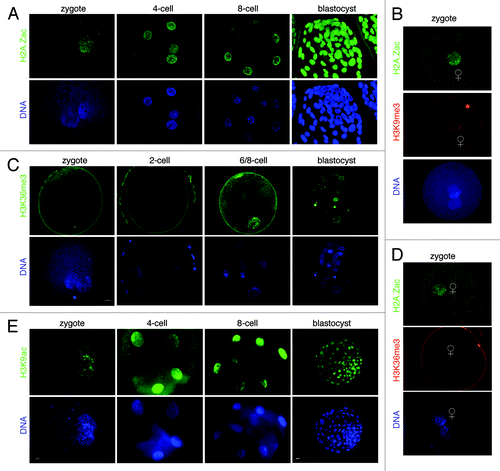
Figure 6. Developmental dynamics of H2A.Zac, H3K36me3 and H3K9ac in bovine embryos. (A) Analysis of H2A.Z acetylation in cleavage stage bovine embryos. H2A.Z is acetylated in the zygote and throughout pre-implantation development. Note that in bovine embryos H2A.Zac defines a parental epigenetic asymmetry as only the female PN contains acetylated H2A.Z. The number of embryos analyzed was: 32 zygotes, 24 8-cell stage embryos and 21 blastocysts. Scale bar is 5µm. (B) H2A.Z marks exclusively the maternal chromatin in bovine zygotes. Co-staining of H2A.Zac and H3K9me3 in bovine zygotes. Zygotes (n = 32) were analyzed by confocal microscopy as above. (C) H3K36me3 shows a heterogeneous distribution in bovine pre-implantation embryos. H3K36me3 is undetectable in bovine zygotes after fertilization. H3K36 methylation occurs only in few nuclei in 4-cell stage embryos and blastocysts. A total of 45 zygotes, 21 2-cell stage embryos, 16 4-cell stage embryos and 18 blastocysts were analyzed. Scale bar is 5µm. (D) H3K36me3 marks the female pronucleus exclusively at the earliest stages of bovine development immediately after fertilization. Early zygotes (17h post-fertilization) were processed for immunostaining with the H2A.Zac and the H3K36me3 antibody. Out of 20 embryos analyzed, 8 zygotes had H3K36me3 staining, which co-localized with H2AZac on the female PN. (E) H3K9ac is present throughout bovine pre-implantation development. Embryos were analyzed as above with an H3K9ac antibody. H3K9ac marks equally well both pronuclei. Note that the 2-cell stage is a very transient stage and therefore it is not included in our figure.