1,034
Views
10
CrossRef citations to date
0
Altmetric
Research Paper

The TCF4/β-catenin pathway and chromatin structure cooperate to regulate D-glucuronyl C5-epimerase expression in breast cancer

, , , , , , , , , , & show all
Pages 930-939 | Published online: 18 Jul 2012

Figures & data

Figure 1.GLCE expression in the human breast tumors. (A) Representative RT-PCR electropherogram, (B) GLCE expression in tumor samples T, related to the match control breast tissue samples C, 1 – similar expression in both samples, upper and down – upregulation or downregulation of GLCE expression, respectively, 301–328 - patients.
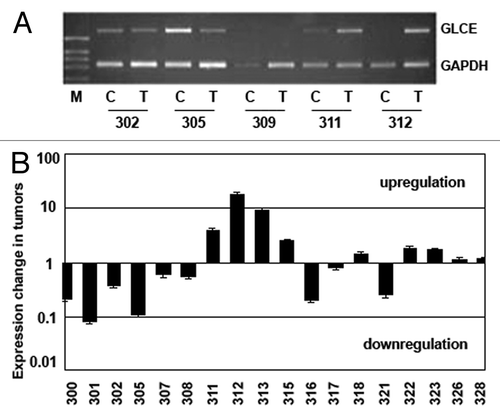
Figure 1.GLCE expression in the human breast tumors. (A) Representative RT-PCR electropherogram, (B) GLCE expression in tumor samples T, related to the match control breast tissue samples C, 1 – similar expression in both samples, upper and down – upregulation or downregulation of GLCE expression, respectively, 301–328 - patients.

Figure 2. Methylation of GLCE promoter-associated CpG islands in human breast tumors and cancer cell lines. (A) Schematic showing the CpG islands in the GLCE promoter region. Location of methylation-specific and bisulphite sequencing PCR primers are indicated by arrows. (B) Methylation-specific PCR for the GLCE promoter region. 300–328 - breast tumors, C and T, control and tumor breast tissues (match pairs from each patient); PC, positive PCR control; NC, negative PCR control; M, DNA marker; M and U, primers for methylated or unmethylated DNA sequences, respectively. (C and D) Bisulphite sequencing of breast tumors (C) and breast cancer cell lines MCF7 and T47D (D) using the BS1 primer pair. 300 and 301 patients, 7 different E. coli clones (1–7) were sequenced for each breast tumor or cell line, open and black circles are non-methylated and methylated CpG dinucleotides, respectively.
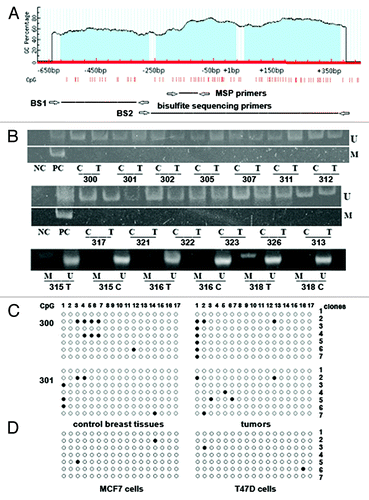
Figure 2. Methylation of GLCE promoter-associated CpG islands in human breast tumors and cancer cell lines. (A) Schematic showing the CpG islands in the GLCE promoter region. Location of methylation-specific and bisulphite sequencing PCR primers are indicated by arrows. (B) Methylation-specific PCR for the GLCE promoter region. 300–328 - breast tumors, C and T, control and tumor breast tissues (match pairs from each patient); PC, positive PCR control; NC, negative PCR control; M, DNA marker; M and U, primers for methylated or unmethylated DNA sequences, respectively. (C and D) Bisulphite sequencing of breast tumors (C) and breast cancer cell lines MCF7 and T47D (D) using the BS1 primer pair. 300 and 301 patients, 7 different E. coli clones (1–7) were sequenced for each breast tumor or cell line, open and black circles are non-methylated and methylated CpG dinucleotides, respectively.

Figure 3. Activation of GLCE expression in MCF7 breast carcinoma cells by 5-aza-deoxycytidine or Trichostatin A. The intensity of the amplified GLCE DNA fragments was normalized to that of GAPDH (multiplex RT-PCR) and β-actin (Taqman-based qReal-Time RT-PCR). Bars represent the mean ± SD from triplicate experiments, **p < 0.01 – p values between MCF7 - TSA400-treated MCF7 and MCF7 - aza-TSA400-treated MCF7 data points (OriginPro 8.1). 5-aza-dC, 5-aza-deoxycytidine; TSA, Trichostatin A.
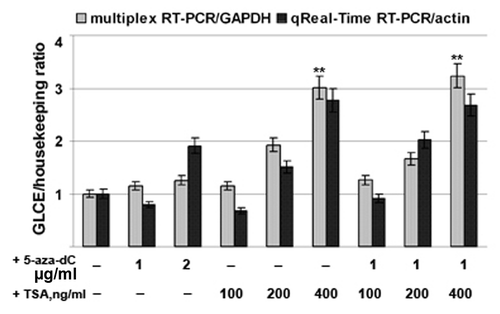
Figure 3. Activation of GLCE expression in MCF7 breast carcinoma cells by 5-aza-deoxycytidine or Trichostatin A. The intensity of the amplified GLCE DNA fragments was normalized to that of GAPDH (multiplex RT-PCR) and β-actin (Taqman-based qReal-Time RT-PCR). Bars represent the mean ± SD from triplicate experiments, **p < 0.01 – p values between MCF7 - TSA400-treated MCF7 and MCF7 - aza-TSA400-treated MCF7 data points (OriginPro 8.1). 5-aza-dC, 5-aza-deoxycytidine; TSA, Trichostatin A.

Figure 4. Involvement of chromatin structure in GLCE activation upon TSA treatment. (A) Changes in the expression of different histone modifications in MCF7 cells after 5-aza-dC and TSA treatment. Western blot (WB) analysis with specific antibodies. (B) Chromatin immunoprecipitation assay for the GLCE promoter region. Chromatin DNA was immunoprecipitated with ChIP-grade antibodies and DNA fragments corresponding to 183 bp in the GLCE promoter region were amplified by PCR. The amount of immunoprecipitated DNA was normalized to that of the input DNA. *p < 0.05 – p values between MCF7 - aza-TSA400-treated MCF7 data points.
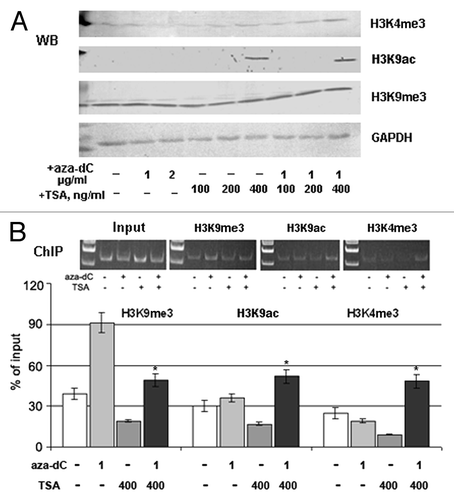
Figure 4. Involvement of chromatin structure in GLCE activation upon TSA treatment. (A) Changes in the expression of different histone modifications in MCF7 cells after 5-aza-dC and TSA treatment. Western blot (WB) analysis with specific antibodies. (B) Chromatin immunoprecipitation assay for the GLCE promoter region. Chromatin DNA was immunoprecipitated with ChIP-grade antibodies and DNA fragments corresponding to 183 bp in the GLCE promoter region were amplified by PCR. The amount of immunoprecipitated DNA was normalized to that of the input DNA. *p < 0.05 – p values between MCF7 - aza-TSA400-treated MCF7 data points.

Figure 5. Wnt pathway repression in TSA-treated MCF7 breast cancer cells. (A) Fold changes in the expression of 84 genes relevant to the Wnt signaling pathway. Fold change in normalized gene expression in the Test Sample (TSA-treated MCF7 cells) divided by the normalized gene expression in the Control Sample (MCF7 cells). The middle line shows similar expression in both groups with 2-fold change boundaries. (B) Pathway activity score for Wnt signaling in experimental samples relative to control samples.
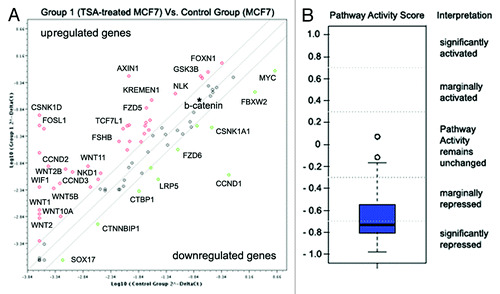
Figure 5. Wnt pathway repression in TSA-treated MCF7 breast cancer cells. (A) Fold changes in the expression of 84 genes relevant to the Wnt signaling pathway. Fold change in normalized gene expression in the Test Sample (TSA-treated MCF7 cells) divided by the normalized gene expression in the Control Sample (MCF7 cells). The middle line shows similar expression in both groups with 2-fold change boundaries. (B) Pathway activity score for Wnt signaling in experimental samples relative to control samples.

Figure 6.GLCE, TCF4 and β-catenin expression in human breast tumors in vivo. (A) The intensity of the amplified DNA fragments was normalized to that of GAPDH (multiplex RT-PCR). Bars represent the mean ± SD from triplicate experiments; Pearson's correlation coefficients are shown (OriginPro 8.1). (B) A tumor/control ratio for GLCE, TCF4 and β-catenin expression calculated for each clinical sample. 300–326, breast tumors; C and T, control and tumor breast tissues (match pairs from each patient).
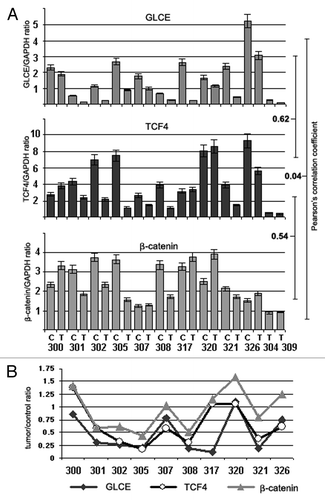
Figure 6.GLCE, TCF4 and β-catenin expression in human breast tumors in vivo. (A) The intensity of the amplified DNA fragments was normalized to that of GAPDH (multiplex RT-PCR). Bars represent the mean ± SD from triplicate experiments; Pearson's correlation coefficients are shown (OriginPro 8.1). (B) A tumor/control ratio for GLCE, TCF4 and β-catenin expression calculated for each clinical sample. 300–326, breast tumors; C and T, control and tumor breast tissues (match pairs from each patient).

Figure 7. Effects of Trichostatin A on GLCE, TCF4 and β-catenin expression and GLCE transcriptional activation in MCF7 breast carcinoma cells in vitro. (A) GLCE, TCF4 and β-catenin expression upon treatment with 5-aza-deoxycytidine (5-aza-dC) and/or Trichostatin A (TSA). Representative multiplex RT-PCR electropherogram with GAPDH gene as an internal control. (B) Intensity of the amplified DNA fragments normalized to that of GAPDH. Bars represent the mean ± SD of triplicate experiments (OriginPro 8.1). (C) ChIP assay for the GLCE promoter region with anti-TCF4 or anti-β-catenin antibodies. DNA fragments corresponding to TCF4-responsive region of the GLCE promoter were amplified using P1 primers, TCF4-non-responsive promoter regions were amplified with P2 and P3 primers as control. The amount of immunoprecipitated DNA was normalized to that of the input DNA, TSA concentration was 400 ng/ml.
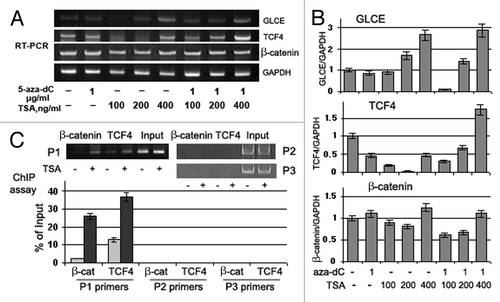
Figure 7. Effects of Trichostatin A on GLCE, TCF4 and β-catenin expression and GLCE transcriptional activation in MCF7 breast carcinoma cells in vitro. (A) GLCE, TCF4 and β-catenin expression upon treatment with 5-aza-deoxycytidine (5-aza-dC) and/or Trichostatin A (TSA). Representative multiplex RT-PCR electropherogram with GAPDH gene as an internal control. (B) Intensity of the amplified DNA fragments normalized to that of GAPDH. Bars represent the mean ± SD of triplicate experiments (OriginPro 8.1). (C) ChIP assay for the GLCE promoter region with anti-TCF4 or anti-β-catenin antibodies. DNA fragments corresponding to TCF4-responsive region of the GLCE promoter were amplified using P1 primers, TCF4-non-responsive promoter regions were amplified with P2 and P3 primers as control. The amount of immunoprecipitated DNA was normalized to that of the input DNA, TSA concentration was 400 ng/ml.

Reprints and Corporate Permissions

Please note: Selecting permissions does not provide access to the full text of the article, please see our help page How do I view content?

To request a reprint or corporate permissions for this article, please click on the relevant link below:

Academic Permissions

Please note: Selecting permissions does not provide access to the full text of the article, please see our help page How do I view content?

Obtain permissions instantly via Rightslink by clicking on the button below:

If you are unable to obtain permissions via Rightslink, please complete and submit this Permissions form. For more information, please visit our Permissions help page.