Figures & data
Figure 1. The methylation of miR-29a and miR-1256 promoters leads to decreased expression of miR-29a and miR-1256. Computerized analysis showed that there are many CpG sites in the promoters of miR-29a (A) and miR-1256 (B). Real-time RT-PCR showed that the expressions of miR-29a and miR-1256 were significantly downregulated in PCa cells [(C) *p < 0.05; n = 3] and in human prostate tumor tissues [(D) n = 46] compared with normal prostate epithelial cells and normal human prostate tissues.
![Figure 1. The methylation of miR-29a and miR-1256 promoters leads to decreased expression of miR-29a and miR-1256. Computerized analysis showed that there are many CpG sites in the promoters of miR-29a (A) and miR-1256 (B). Real-time RT-PCR showed that the expressions of miR-29a and miR-1256 were significantly downregulated in PCa cells [(C) *p < 0.05; n = 3] and in human prostate tumor tissues [(D) n = 46] compared with normal prostate epithelial cells and normal human prostate tissues.](/cms/asset/c5040139-85f5-42ff-9ad4-40844ff48d25/kepi_a_10921236_f0001.gif)
Table 1. The methylation index of miR-29a and miR-1256 promoters in prostate cancer group and normal cells group measured by Methylation450 chip assay
Table 2. The methylation index of miR-29a and miR-1256 promoters altered by isoflavone (G2535) and Aza-dC in prostate cancer cells measured by Methylation450 chip assay
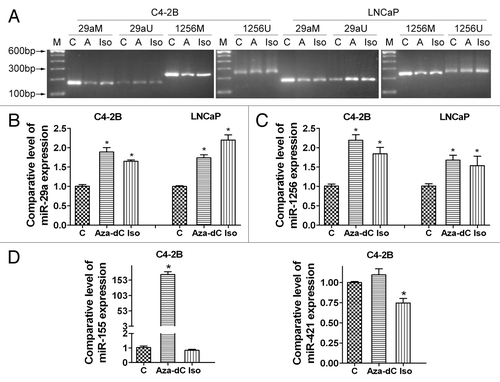
Figure 2. The effects of isoflavone on miR-29a and miR-1256 expression. Methylation specific PCR showed that isoflavone or Aza-dC treatments could partly demethylate the promoters of miR-29a and miR-1256 (A). Real-time RT-PCR showed increased expression of miR-29a (B) and miR-1256 (C) after isoflavone or Aza-dC treatment. However, isoflavone and Aza-dC had differential effects on the expression of miR-155 and miR-421 (D). (C, control; A, Aza-dC; Iso, isoflavone; M, methylation; U, unmethylation)

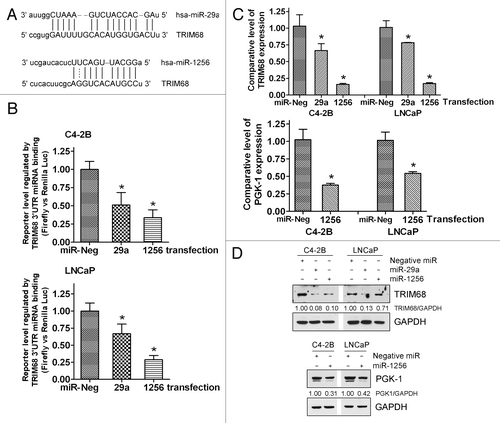
Figure 3. Targeting TRIM68 by miR-29a and miR-1256. Computerized analysis showed miR-29a and miR-1256 sequence alignment to the sequence of TRIM68 3′UTR (A). Co-transfection of TRIM68 3′UTR-Luc and miR-29a, miR-1256 mimic, or negative control miRNA showed that miR-29a and miR-1256 directly bond to the 3′UTR of TRIM68 (B). Transfection of miR-29a, miR-1256 mimic, or negative control miRNA into PCa cells caused downregulation of TRIM68 and PGK-1 at mRNA (C) and protein (D) levels. (Neg: negative control miRNA; 29a: miR-29a; 1256: miR-1256; *: p < 0.05, n = 3)

Figure 4. The expression of TRIM68 and PGK-1. A significantly higher mRNA expression of TRIM68 and PGK-1 was observed in PCa cells [(A) *: p < 0.05; n = 3] and in human prostate tumor tissues [(B) n = 46] compared with normal prostate epithelial cells and normal human prostate tissues measured by real-time RT-PCR. A significantly higher expression of TRIM68 and PGK-1 proteins were also observed in PCa cells compared with normal prostate epithelial cells as assessed by Western Blot analysis (C).
![Figure 4. The expression of TRIM68 and PGK-1. A significantly higher mRNA expression of TRIM68 and PGK-1 was observed in PCa cells [(A) *: p < 0.05; n = 3] and in human prostate tumor tissues [(B) n = 46] compared with normal prostate epithelial cells and normal human prostate tissues measured by real-time RT-PCR. A significantly higher expression of TRIM68 and PGK-1 proteins were also observed in PCa cells compared with normal prostate epithelial cells as assessed by Western Blot analysis (C).](/cms/asset/acf5e1fa-4801-42cb-800a-93aec92c0116/kepi_a_10921236_f0004.gif)
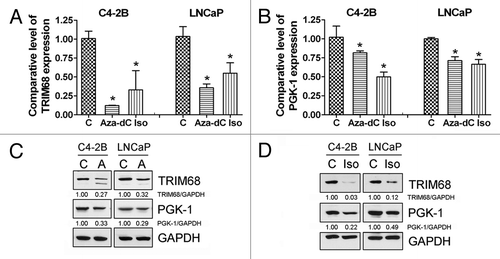
Figure 5. TRIM68 and PGK-1 expression was altered by isoflavone and Aza-dC. (A and B) Real-time RT-PCR showed that the expression of TRIM68 (A) and PGK-1 (B) mRNA were significantly inhibited by isoflavone and Aza-dC treatment. (C and D) western blot analysis showed that the expression of TRIM68 (C) and PGK-1 (D) proteins were inhibited by isoflavone (D) and Aza-dC (C). (C, control; Iso, isoflavone; A, Aza-dC; *p < 0.05, n = 3)

Table 3. TRIM68 and PGK-1 mRNA expression altered by isoflavone (G2535) and Aza-dC measured by microarray
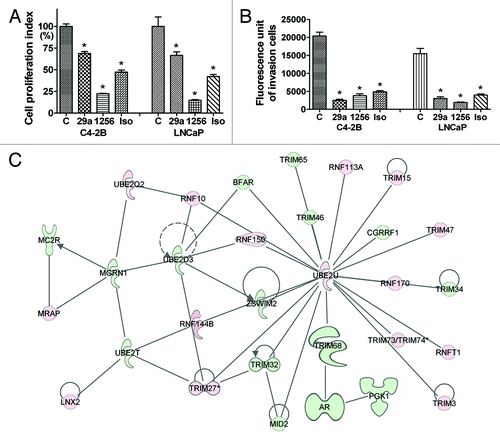
Figure 6. Inhibition of cell growth and invasion by miR-29a, miR-1256 and isoflavone through TRIM68/AR and PGK-1 signaling. Transfection of miR-29a and miR-1256 mimic into PCa cells, and isoflavone treatment significantly inhibited cell growth (A) and invasion (B) of PCa cells (*: p < 0.05; n = 3). Microarray and Ingenuity Pathway analysis showed that isoflavone downregulated TRIM68/AR and PGK-1 signaling (C; Green: downregulated; Red: upregulated).
