962
Views
16
CrossRef citations to date
0
Altmetric
Research Paper

Whole DNA methylome profiling in mice exposed to secondhand smoke

, , , , &
Pages 1302-1314 | Received 02 Aug 2012, Accepted 04 Oct 2012, Published online: 10 Oct 2012

Figures & data

Figure 1. Genome-wide profiling of DNA methylation in SHS-exposed mice vs. control. The Hierarchical Clustering Analysis was used to generate heatmaps of DNA methylation profile in the lung of SHS-exposed mice and control. Representative heatmaps from samples of SHS-exposed mice (immediately after treatment, and after 1 mo and 7 mo recovery periods) and control are shown. Of note, the three panels show three different sets of several thousand CpG islands representing three snap shots of the whole methylome. To account for “age” as a potential confounder, two groups of control mice, including controlCitation1 (6 mo old clean-air mock-treated mice) and controlCitation2 (16 mo old clean-air mock-treated mice) were used. Numbers indicate mouse IDs. For comparison, heatmaps of DNA methylation profile in tumor DNA from B(a)P-treated mice vs. control (DMSO) are shown.
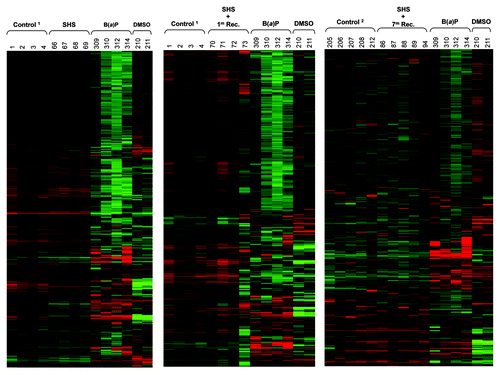
Figure 1. Genome-wide profiling of DNA methylation in SHS-exposed mice vs. control. The Hierarchical Clustering Analysis was used to generate heatmaps of DNA methylation profile in the lung of SHS-exposed mice and control. Representative heatmaps from samples of SHS-exposed mice (immediately after treatment, and after 1 mo and 7 mo recovery periods) and control are shown. Of note, the three panels show three different sets of several thousand CpG islands representing three snap shots of the whole methylome. To account for “age” as a potential confounder, two groups of control mice, including controlCitation1 (6 mo old clean-air mock-treated mice) and controlCitation2 (16 mo old clean-air mock-treated mice) were used. Numbers indicate mouse IDs. For comparison, heatmaps of DNA methylation profile in tumor DNA from B(a)P-treated mice vs. control (DMSO) are shown.

Table 1. Differentially methylated targets detected in the lung DNA of SHS-exposed mice versus controls

Figure 2. Verification of marginal hypermethylation in the Cacna1 gene and hypomethylation in the H2-T23 gene in SHS-exposed mice vs. control. Genomic DNA isolated from the lung of SHS-exposed and control mice was treated with sodium bisulfite, and the CpG islands within the Cacna1s and H2-T23 genes were amplified with gene-specific primers, and subjected to COBRA.Citation28 Representative results for samples of SHS-exposed mice (before and after 1, 4, 7 and 10 mo recovery periods) and control are shown (upper panels). The COBRA results consistently show no differences in the extent of DNA methylation in the specified CpG islands between experimental and control mice. Digested fragments on the gel are indicative of methylated BstUI restriction sites (5′-CGCG) within the Cacna1s CpG island, and TaqI restriction sites (5′-TCGA) within the H2-T23 CpG island. Mouse genomic DNA, isolated from the lung, was methylated in vitro with the SssI methyltransferase, and served as control (Ctrl). (+) and (-) represent the presence and absence, respectively, of the restriction enzymes in the reaction mix. Numbers indicate mouse IDs. M, 100 bp ladder DNA marker. The extent of CpG methylation within the Cacna1s and H2-T23 CpG islands was determined by sodium-bisulfite sequencingCitation29 in the lung genomic DNA from SHS-exposed and control mice. Based on microarray data, samples of SHS-exposed mice, which showed the highest hyper/hypomethylation in the specified CpG islands, were subjected to bisulfite genomic sequencing (lower panels). The sequencing results of randomly selected independent clones from both the experimental and control mice were analyzed using the BIQ Analyzer software (http://biq-analyzer.bioinf.mpi-inf.mpg.de/). The methylation status of each individual CpG dinucleotide within the Cacna1s and H2-T23 CpG islands per experimental and control groups is indicated by the number of methylated-, unmethylated, and mutated (other) CpGs detected in the sequenced clones from each group of experimental or control mice. The heights of yellow, blue, and gray bars, respectively, represent the percentages of methylated, unmethylated, and mutated CpGs at each CpG dinucleotide within the Cacna1s and H2-T23 CpG islands. Numbers along the reference sequence show the distance between interrogated CpGs within the Cacna1s and H2-T23 CpG islands. Average results per experimental or control groups are shown as Methylation Index (MI = mean ± SD). Marginal differences in MI between experimental and control mice were not statistically significant (Fisher’s exact test).
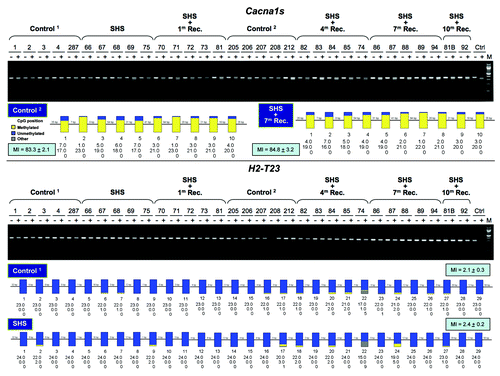
Figure 2. Verification of marginal hypermethylation in the Cacna1 gene and hypomethylation in the H2-T23 gene in SHS-exposed mice vs. control. Genomic DNA isolated from the lung of SHS-exposed and control mice was treated with sodium bisulfite, and the CpG islands within the Cacna1s and H2-T23 genes were amplified with gene-specific primers, and subjected to COBRA.Citation28 Representative results for samples of SHS-exposed mice (before and after 1, 4, 7 and 10 mo recovery periods) and control are shown (upper panels). The COBRA results consistently show no differences in the extent of DNA methylation in the specified CpG islands between experimental and control mice. Digested fragments on the gel are indicative of methylated BstUI restriction sites (5′-CG▼CG) within the Cacna1s CpG island, and TaqI restriction sites (5′-T▼CGA) within the H2-T23 CpG island. Mouse genomic DNA, isolated from the lung, was methylated in vitro with the SssI methyltransferase, and served as control (Ctrl). (+) and (-) represent the presence and absence, respectively, of the restriction enzymes in the reaction mix. Numbers indicate mouse IDs. M, 100 bp ladder DNA marker. The extent of CpG methylation within the Cacna1s and H2-T23 CpG islands was determined by sodium-bisulfite sequencingCitation29 in the lung genomic DNA from SHS-exposed and control mice. Based on microarray data, samples of SHS-exposed mice, which showed the highest hyper/hypomethylation in the specified CpG islands, were subjected to bisulfite genomic sequencing (lower panels). The sequencing results of randomly selected independent clones from both the experimental and control mice were analyzed using the BIQ Analyzer software (http://biq-analyzer.bioinf.mpi-inf.mpg.de/). The methylation status of each individual CpG dinucleotide within the Cacna1s and H2-T23 CpG islands per experimental and control groups is indicated by the number of methylated-, unmethylated, and mutated (other) CpGs detected in the sequenced clones from each group of experimental or control mice. The heights of yellow, blue, and gray bars, respectively, represent the percentages of methylated, unmethylated, and mutated CpGs at each CpG dinucleotide within the Cacna1s and H2-T23 CpG islands. Numbers along the reference sequence show the distance between interrogated CpGs within the Cacna1s and H2-T23 CpG islands. Average results per experimental or control groups are shown as Methylation Index (MI = mean ± SD). Marginal differences in MI between experimental and control mice were not statistically significant (Fisher’s exact test).
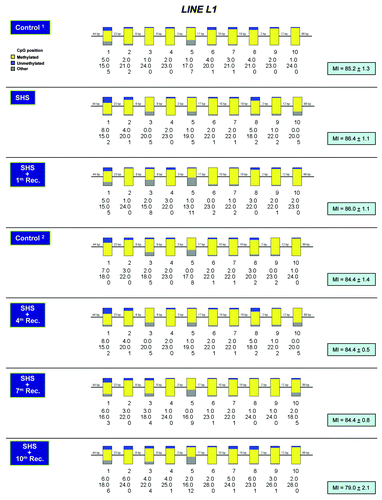
Figure 3. Methylation profiling of LINE L1 repetitive DNA elements in SHS-exposed mice vs. control. Bisulfite sequencing of LINE L1 elements was performed on genomic DNA isolated from the lung of SHS-exposed and control mice using a published protocol.Citation33 Representative results for samples of SHS-exposed mice (immediately after treatment, and after 1, 4, 7 and 10 mo recovery periods) and control are shown. The methylation status of each individual CpG dinucleotide within the LINE L1 element per experimental and control groups is indicated by the number of methylated, unmethylated and mutated (other) CpGs detected in the sequenced clones from each group of experimental or control mice. The heights of yellow, blue and gray bars, respectively, represent the percentages of methylated-, unmethylated-, and mutated-CpGs at each CpG dinucleotide within the LINE L1 element. Numbers along the reference sequence show the distance between interrogated CpGs within the LINE L1 element. Average results per experimental or control groups are shown as Methylation Index (MI = mean ± SD). Marginal differences in MI between experimental and control mice were not statistically significant (Fisher’s exact test).
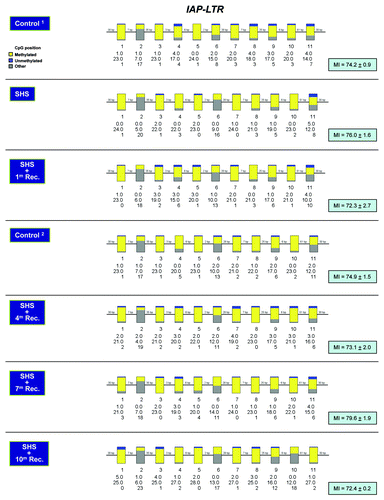
Figure 3. Methylation profiling of LINE L1 repetitive DNA elements in SHS-exposed mice vs. control. Bisulfite sequencing of LINE L1 elements was performed on genomic DNA isolated from the lung of SHS-exposed and control mice using a published protocol.Citation33 Representative results for samples of SHS-exposed mice (immediately after treatment, and after 1, 4, 7 and 10 mo recovery periods) and control are shown. The methylation status of each individual CpG dinucleotide within the LINE L1 element per experimental and control groups is indicated by the number of methylated, unmethylated and mutated (other) CpGs detected in the sequenced clones from each group of experimental or control mice. The heights of yellow, blue and gray bars, respectively, represent the percentages of methylated-, unmethylated-, and mutated-CpGs at each CpG dinucleotide within the LINE L1 element. Numbers along the reference sequence show the distance between interrogated CpGs within the LINE L1 element. Average results per experimental or control groups are shown as Methylation Index (MI = mean ± SD). Marginal differences in MI between experimental and control mice were not statistically significant (Fisher’s exact test).
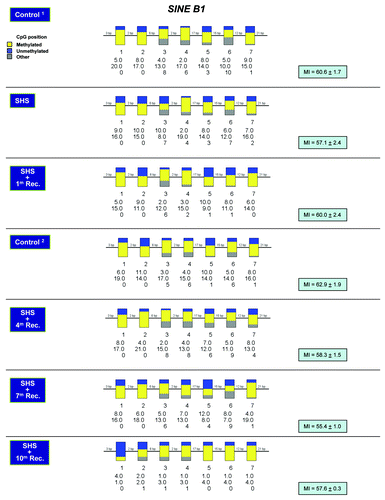
Figure 4. Methylation profiling of IAP-LTR repetitive DNA elements in SHS-exposed mice vs. control. Bisulfite sequencing of IAP-LTR elements was performed on genomic DNA isolated from the lung of SHS-exposed and control mice using a published protocol.Citation33 Representative results for samples of SHS-exposed mice (immediately after treatment, and after 1, 4, 7 and 10 mo recovery periods) and control are shown (see legend for ). Marginal differences in MI between experimental and control mice were not statistically significant (Fisher’s exact test).

Figure 4. Methylation profiling of IAP-LTR repetitive DNA elements in SHS-exposed mice vs. control. Bisulfite sequencing of IAP-LTR elements was performed on genomic DNA isolated from the lung of SHS-exposed and control mice using a published protocol.Citation33 Representative results for samples of SHS-exposed mice (immediately after treatment, and after 1, 4, 7 and 10 mo recovery periods) and control are shown (see legend for Fig. 3). Marginal differences in MI between experimental and control mice were not statistically significant (Fisher’s exact test).

Figure 5. Methylation profiling of SINE B1 repetitive DNA elements in SHS-exposed mice vs. control. Bisulfite sequencing of SINE B1 elements was performed on genomic DNA isolated from the lung of SHS-exposed and control mice using a published protocol.Citation33 Representative results for samples of SHS-exposed mice (immediately after treatment, and after 1, 4, 7 and 10 mo recovery periods) and control are shown (see legend for ). Marginal differences in MI between experimental and control mice were not statistically significant (Fisher’s exact test).

Figure 5. Methylation profiling of SINE B1 repetitive DNA elements in SHS-exposed mice vs. control. Bisulfite sequencing of SINE B1 elements was performed on genomic DNA isolated from the lung of SHS-exposed and control mice using a published protocol.Citation33 Representative results for samples of SHS-exposed mice (immediately after treatment, and after 1, 4, 7 and 10 mo recovery periods) and control are shown (see legend for Fig. 3). Marginal differences in MI between experimental and control mice were not statistically significant (Fisher’s exact test).

Figure 6. Global gene expression profiling in SHS-exposed mice vs. control. Genome-wide gene expression profiling was performed on RNA samples from SHS-exposed and control mice using the GeneChip® Mouse Genome 430 2.0 Array (Affymetrix Inc.). Representative results from samples of SHS-exposed mice (immediately after 4-mo treatment) and controlCitation1 (6 mo old clean-air mock-treated mice) are shown. (A) Heatmap of gene expression profiles in the lung of SHS-exposed mice and control by the Hierarchical Clustering Analysis. Numbers indicate mouse IDs. (B) Principal Component Analysis of gene expression profiles in the lung of SHS-exposed mice and control by the Partek Genomics Suite v6.11.1116 (www.partek.com). (C) Summary of differentially expressed genes identified in the lung of SHS-exposed mice relative to control. The Bioconductor package “ArrayTool” was used to identify differentially expressed genes in experimental mice vs. control. Genes with significantly different expression levels were selected by using a cutoff p value of < 0.05, and 2-fold change (log2 = 1) in expression level. The number of upregulated- and downregulated genes together with fold-change in expression level (range) in experimental mice vs. control is shown.
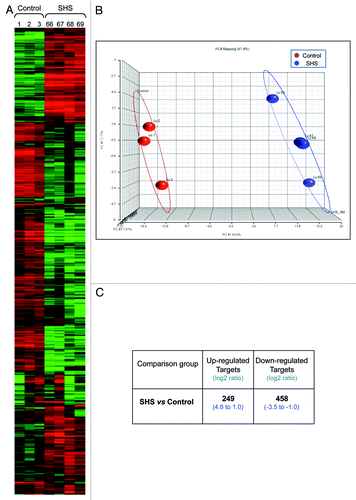
Figure 6. Global gene expression profiling in SHS-exposed mice vs. control. Genome-wide gene expression profiling was performed on RNA samples from SHS-exposed and control mice using the GeneChip® Mouse Genome 430 2.0 Array (Affymetrix Inc.). Representative results from samples of SHS-exposed mice (immediately after 4-mo treatment) and controlCitation1 (6 mo old clean-air mock-treated mice) are shown. (A) Heatmap of gene expression profiles in the lung of SHS-exposed mice and control by the Hierarchical Clustering Analysis. Numbers indicate mouse IDs. (B) Principal Component Analysis of gene expression profiles in the lung of SHS-exposed mice and control by the Partek Genomics Suite v6.11.1116 (www.partek.com). (C) Summary of differentially expressed genes identified in the lung of SHS-exposed mice relative to control. The Bioconductor package “ArrayTool” was used to identify differentially expressed genes in experimental mice vs. control. Genes with significantly different expression levels were selected by using a cutoff p value of < 0.05, and 2-fold change (log2 = 1) in expression level. The number of upregulated- and downregulated genes together with fold-change in expression level (range) in experimental mice vs. control is shown.
Supplemental material

Additional material

Download Zip (446.5 KB)