2,578
Views
63
CrossRef citations to date
0
Altmetric
Research Paper

Epigenetic marks in an adaptive water stress-responsive gene in tomato roots under normal and drought conditions

, &
Pages 864-872 | Received 08 Feb 2013, Accepted 24 Jun 2013, Published online: 27 Jun 2013

Figures & data

Figure 1. Overall methylation levels in the Asr2 regulatory region and gene body. Data were grouped by methylation context in the regulatory region, which is located upstream of the transcription start site (A), and coding region (B) under both normal conditions and after 30 min of water stress. (C) Schematic representation of the entire gene, aligned to (Aand B), showing the annealing positions of the primers relative to the +1 site designed for the post-bisulfite PCR analysis. The amplicon sizes and number of cytosine residues in each context existing in the amplicons analyzed for (Aand B) are also shown. The error bars indicate the standard error (SEM). The slight decrease in the overall CNN methylation in the regulatory region was significant (*P < 0.05). The increased values in the CNG (***P < 0.001) and CNN (**P < 0.01) methylation in the coding region were also significant. The bisulfite treatments were performed as indicated in Materials and Methods. The primers for post-bisulfite PCR are listed Table S1. GenBank accession numbers for Asr2: L20756, CU468249, and X74907.
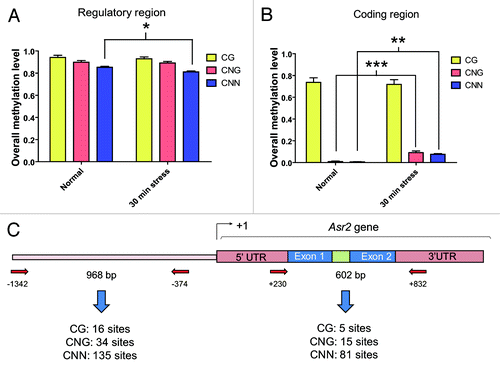
Figure 1. Overall methylation levels in the Asr2 regulatory region and gene body. Data were grouped by methylation context in the regulatory region, which is located upstream of the transcription start site (A), and coding region (B) under both normal conditions and after 30 min of water stress. (C) Schematic representation of the entire gene, aligned to (Aand B), showing the annealing positions of the primers relative to the +1 site designed for the post-bisulfite PCR analysis. The amplicon sizes and number of cytosine residues in each context existing in the amplicons analyzed for (Aand B) are also shown. The error bars indicate the standard error (SEM). The slight decrease in the overall CNN methylation in the regulatory region was significant (*P < 0.05). The increased values in the CNG (***P < 0.001) and CNN (**P < 0.01) methylation in the coding region were also significant. The bisulfite treatments were performed as indicated in Materials and Methods. The primers for post-bisulfite PCR are listed Table S1. GenBank accession numbers for Asr2: L20756, CU468249, and X74907.

Figure 2. Detailed inspection of the stress-induced changes in asymmetric methylation (CNN) within the Asr2 regulatory region. The moving average statistical tool (http://lorien.ncl.ac.uk/ming/filter/filmav.htm) was employed. The X-axis represents 10-cytosine (5 left + 5 right) windows for each position corresponding to the 142 cytosine residues (CNN) existing in this region. Y-axis units represent the moving average of the differences between the methylation level for each cytosine under stress and the methylation level for the same cytosine under no stress. Some position numbers relative to the +1 transcription start site are indicated.
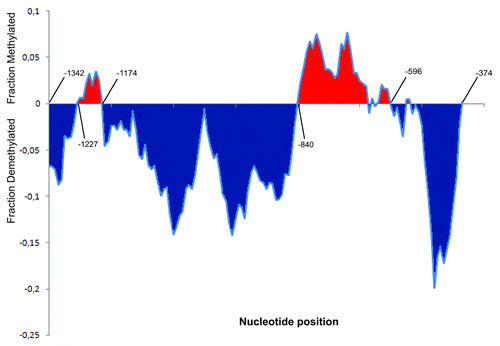
Figure 2. Detailed inspection of the stress-induced changes in asymmetric methylation (CNN) within the Asr2 regulatory region. The moving average statistical tool (http://lorien.ncl.ac.uk/ming/filter/filmav.htm) was employed. The X-axis represents 10-cytosine (5 left + 5 right) windows for each position corresponding to the 142 cytosine residues (CNN) existing in this region. Y-axis units represent the moving average of the differences between the methylation level for each cytosine under stress and the methylation level for the same cytosine under no stress. Some position numbers relative to the +1 transcription start site are indicated.

Figure 3. Histone marks on the Asr2 regulatory and coding regions. The H3K4me3 (A and B), H3K27me3 (C and D), and H3K9me2 (E and F) levels in the regulatory (A, C, and E) and coding (B, D, and F) regions under both normal conditions and after 30 min of water stress are expressed as % input. ChIP was performed as described in Materials and Methods. (G) Schematic representation of the entire gene, aligned to (A–F), showing the annealing positions of the primers designed for qPCR and the sizes of the analyzed amplicons. The error bars indicate the standard error (SEM). Statistically significant (*P < 0.05, **P < 0.01, ***P < 0.001) histone marks are highlighted. Statistical significance between no-antibody (noise signal) and real ChiP signal is shown except for the evident H3K9me2 mark (E and F) under normal conditions (P < 0.001) for the sake of simplicity, not to mask the pronounced effect of stress on demethylation in both gene regions. The qPCR primers are listed in Table S1.
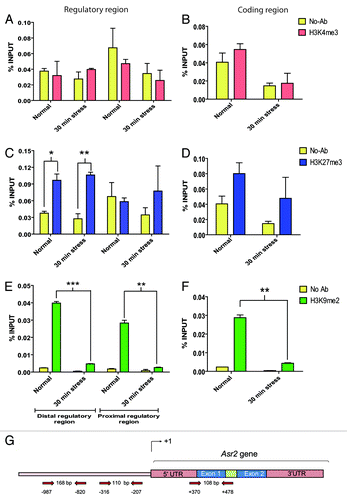
Figure 3. Histone marks on the Asr2 regulatory and coding regions. The H3K4me3 (A and B), H3K27me3 (C and D), and H3K9me2 (E and F) levels in the regulatory (A, C, and E) and coding (B, D, and F) regions under both normal conditions and after 30 min of water stress are expressed as % input. ChIP was performed as described in Materials and Methods. (G) Schematic representation of the entire gene, aligned to (A–F), showing the annealing positions of the primers designed for qPCR and the sizes of the analyzed amplicons. The error bars indicate the standard error (SEM). Statistically significant (*P < 0.05, **P < 0.01, ***P < 0.001) histone marks are highlighted. Statistical significance between no-antibody (noise signal) and real ChiP signal is shown except for the evident H3K9me2 mark (E and F) under normal conditions (P < 0.001) for the sake of simplicity, not to mask the pronounced effect of stress on demethylation in both gene regions. The qPCR primers are listed in Table S1.

Figure 4.Asr2 expression as a consequence of water stress. The root mRNA steady-state levels were measured by qRT-PCR as described in Materials and Methods. The data were normalized to actin (A) or EF-1 (B) mRNA at each stress time before comparing the effects of the different stress treatments. Normalized against EF-1, the difference in the expression levels of Asr2 was statistically significant at 30 min (***P < 0.001). The qRT-PCR primers are listed in Table S1. The error bars indicate the standard error (SEM).
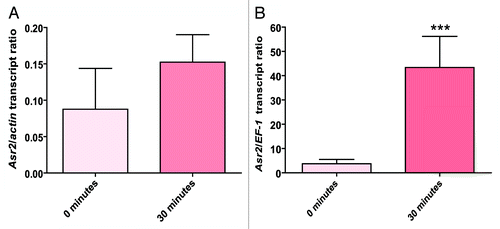
Figure 4.Asr2 expression as a consequence of water stress. The root mRNA steady-state levels were measured by qRT-PCR as described in Materials and Methods. The data were normalized to actin (A) or EF-1 (B) mRNA at each stress time before comparing the effects of the different stress treatments. Normalized against EF-1, the difference in the expression levels of Asr2 was statistically significant at 30 min (***P < 0.001). The qRT-PCR primers are listed in Table S1. The error bars indicate the standard error (SEM).
Supplemental material

Additional material

Download Zip (95.5 KB)