Figures & data
Figure 1. Distribution of MspI digested fragments in zebrafish genome. The red bar represents the size selection performed for the current study, i.e., 40–220 bp.
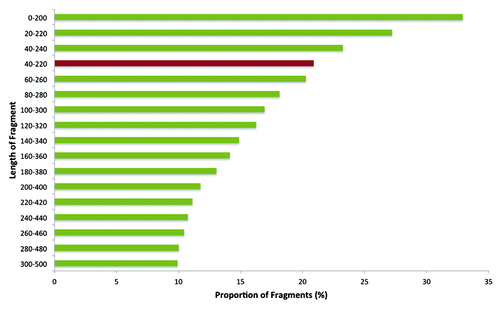
Table 1. Comparison of human and zebrafish RR genome*
Table 2. Details of output and mapping of zebrafish RRBS libraries
Table 3. Number and coverage of CpG10 in zebrafish RRBS methylome after alignment*
Figure 2. CpG site coverage histogram of the zebrafish Male1 RRBS library. The x-axis shows log 10 values corresponding to the number of reads per CpG. The numbers on the bars denote the percentage of CpG sites contained in the respective bins. Log10Citation10 = 1, Log10Citation31 = 1.5, Log10100 = 2, Log10177 = 2.25, Log10317 = 2.5, Log1010000 = 4
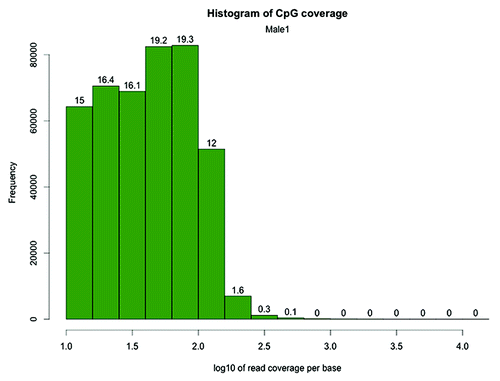
Figure 3. CpG methylation distribution in zebrafish brain. The X-axis shows percent methylation for each CpG. The numbers on the bars denote the percentage of CpGs contained in the respective bins.
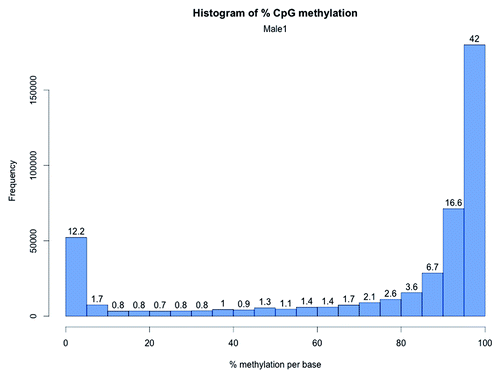
Table 4. Per quartile methylation distribution of CpG10 in zebrafish RRBS samples
Figure 4. CpG methylation distribution in zebrafish liver. The X-axis shows percent methylation for each CpG site. The numbers on the bars denote the percentage of CpGs contained in the respective bins.
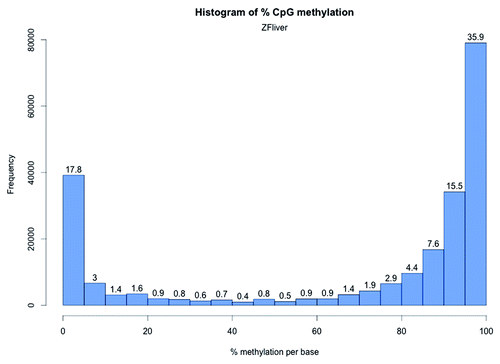
Table 5. Percentage distribution of methylated and unmethylated CpG zebrafish RRBS samples and comparison with zebrafish WGBS*
Figure 5. Scatter plot and correlation of CpG methylation between zebrafish RRBS methylomes. Scatter plots of percentage methylation values for each pair in four zebrafish libraries (Male1, Male2, Female1 and Female2). Numbers on the upper right corner denote pair-wise Pearson’s correlation scores. The histograms on the diagonal are methylation distribution of CpG sites for each sample.
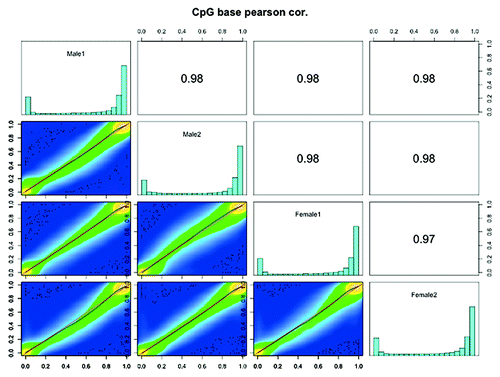
Table 6. Distribution of CpG10 in CpG feature context*
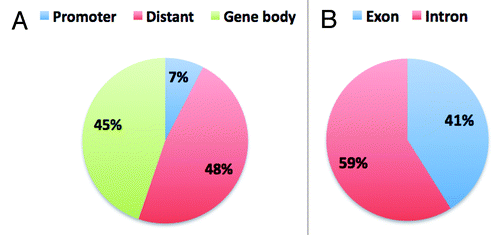
Figure 6. Distribution of CpG10 in genome and in gene body. A. Shows the overall distribution of CpG10 of Male1 sample in the genome. B. Shows the distribution of gene body associated CpG10.
