1,094
Views
19
CrossRef citations to date
0
Altmetric
Research Paper

Evaluation of immunogen delivery by DNA immunization using non-invasive bioluminescence imaging

, , , , , & show all
Pages 2228-2236 | Received 06 Apr 2013, Accepted 27 Jun 2013, Published online: 03 Jul 2013

Figures & data

Figure 1. Dependence of expression of luciferase gene assessed as the total photon flux to the estimated pre-pulse and monitored skin resistance during electroporation (Derma Vax). Analysis of the monitored skin resistance and average photon flux data from pervious Luc gene injection experiments involving 232 injectionsCitation14 (A); Variance of average flux from the injection sites four days after Luc gene injection followed by pre-pulse resistance controlled vs. uncontrolled electroporation (B); Correlation between total photon flux (photons/sec) and electroporation parameters 2 h after injection in mice receiving deep (C) and superficial (D) Luc gene injections. Correlations were done using Spearman rank order test, p < 0.05 were considered significant.
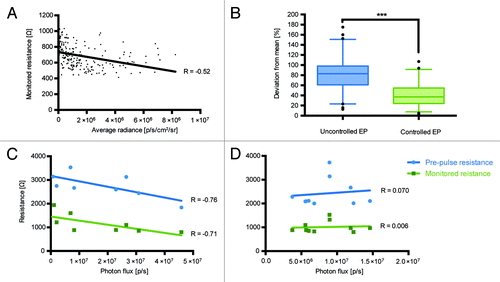
Figure 1. Dependence of expression of luciferase gene assessed as the total photon flux to the estimated pre-pulse and monitored skin resistance during electroporation (Derma Vax). Analysis of the monitored skin resistance and average photon flux data from pervious Luc gene injection experiments involving 232 injectionsCitation14 (A); Variance of average flux from the injection sites four days after Luc gene injection followed by pre-pulse resistance controlled vs. uncontrolled electroporation (B); Correlation between total photon flux (photons/sec) and electroporation parameters 2 h after injection in mice receiving deep (C) and superficial (D) Luc gene injections. Correlations were done using Spearman rank order test, p < 0.05 were considered significant.

Figure 2. Measurement of luminescence in mice receiving deep and superficial injections. The activity of luciferase was monitored by in vivo bioluminescent imaging of mice receiving Luc gene by deep (A) or superficial (B) injections. The images represent a composite of luminescence data (photons/sec) overlaid with a photograph of the subjects. Deep injections resulted in higher and longer-lasting expression of luciferase (C).
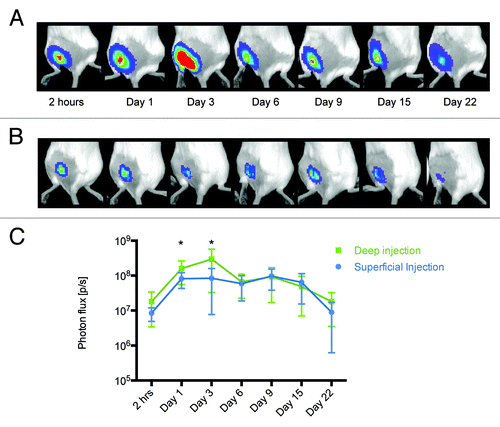
Figure 2. Measurement of luminescence in mice receiving deep and superficial injections. The activity of luciferase was monitored by in vivo bioluminescent imaging of mice receiving Luc gene by deep (A) or superficial (B) injections. The images represent a composite of luminescence data (photons/sec) overlaid with a photograph of the subjects. Deep injections resulted in higher and longer-lasting expression of luciferase (C).

Figure 3. Luciferase expression in BALB/c mice receiving deep or superficial injections of Luc gene. The depth of luciferase expression was verified by 3D BLI 2 h after Luc gene administration. The “center of mass” of luciferase expression localized between 2.0–3.0 mm in mice receiving deep (A) and between 1.0–1.5 mm in mice receiving superficial Luc gene injections (D). Skin was excised post mortem and monitoring was repeated directly after. In mice receiving deep injections (A) luciferase activity was localized to the muscle tissues (B) while none was registered in the skin (C). On contrary, in superficially injected animals (D) luciferase activity was recorded in the skin (F) but not in the muscles (E).
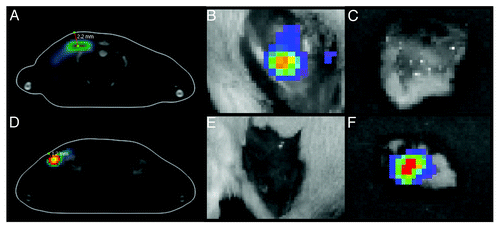
Figure 3. Luciferase expression in BALB/c mice receiving deep or superficial injections of Luc gene. The depth of luciferase expression was verified by 3D BLI 2 h after Luc gene administration. The “center of mass” of luciferase expression localized between 2.0–3.0 mm in mice receiving deep (A) and between 1.0–1.5 mm in mice receiving superficial Luc gene injections (D). Skin was excised post mortem and monitoring was repeated directly after. In mice receiving deep injections (A) luciferase activity was localized to the muscle tissues (B) while none was registered in the skin (C). On contrary, in superficially injected animals (D) luciferase activity was recorded in the skin (F) but not in the muscles (E).

Figure 4. Volume of the tissues transfected after superficial and deep Luc gene injections followed by electroporation. Three-dimensional bioluminescence imaging was used to measure the physical volume of cells expressing luciferase. One day after injection of 20 μg DNA (20 μl) a statistically significant difference in volume of transfected cells was observed. This volume measured 17 mm3 in deep injections and 8 mm3 in superficially injected mice.

Figure 4. Volume of the tissues transfected after superficial and deep Luc gene injections followed by electroporation. Three-dimensional bioluminescence imaging was used to measure the physical volume of cells expressing luciferase. One day after injection of 20 μg DNA (20 μl) a statistically significant difference in volume of transfected cells was observed. This volume measured 17 mm3 in deep injections and 8 mm3 in superficially injected mice.

Figure 5. Immunogenicity of luciferase DNA in BALB/c mice immunized by superficial or deep injections of luciferase gene followed by electroporation. On day 23 post immunization splenocytes were harvested from mice receiving superficial (n = 9) and deep (n = 7) injections of luciferase-coding pVax-Luc and vector-only controls (pVax1, n = 6). Responses of splenocytes stimulated by a peptide representing CD8+ epitope of Luc (GFQSMYTFV) or recombinant luciferase measured by FluoroSpot: secretion of IFN-γ (A), IL-2 (B); Optical density of luciferase-specific antibodies measured by ELISA (C).

Figure 5. Immunogenicity of luciferase DNA in BALB/c mice immunized by superficial or deep injections of luciferase gene followed by electroporation. On day 23 post immunization splenocytes were harvested from mice receiving superficial (n = 9) and deep (n = 7) injections of luciferase-coding pVax-Luc and vector-only controls (pVax1, n = 6). Responses of splenocytes stimulated by a peptide representing CD8+ epitope of Luc (GFQSMYTFV) or recombinant luciferase measured by FluoroSpot: secretion of IFN-γ (A), IL-2 (B); Optical density of luciferase-specific antibodies measured by ELISA (C).

Figure 6. Heatmap of correlations between immune response as measured by slenocyte IFN-γ and IL-2 production (FluoroSpot) and parameters of BLI such as total photon flux (A) and volume of transfected tissue (B). Green indicates an inverse correlation between IFN-γ/IL-2 and BLI parameters (R < 0), whereas red signifies a direct correlation between IFN-γ/IL-2 and BLI parameters (R > 0). Luminescence intensity and transfection volume were measured by BLI and BLT at 7 different time points between 2 h after immunization and 22 d after immunization. The decrease of luminescence was associated with the development of antigen-specific immune responses resulting in a strong inverse correlation between immune response and total photon flux (A). The relationship became apparent 3 d post immunization and showed some degree of variation until day 22, when correlation coefficients returned to their values from day 3. Transfected tissue volume (B) correlated directly with immune response 9 d post immunization, with the exception of IFN-γ levels in response to stimulation by recombinant luciferase, which correlated directly with the transfected volume 22 d post immunization. Transfection volume was measured only once during the first 24 h post immunization (Day 1) to reduce the initial exposure of mice to radiation.
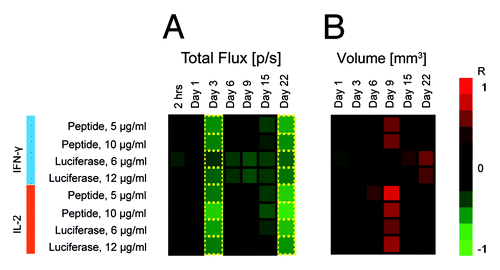
Figure 6. Heatmap of correlations between immune response as measured by slenocyte IFN-γ and IL-2 production (FluoroSpot) and parameters of BLI such as total photon flux (A) and volume of transfected tissue (B). Green indicates an inverse correlation between IFN-γ/IL-2 and BLI parameters (R < 0), whereas red signifies a direct correlation between IFN-γ/IL-2 and BLI parameters (R > 0). Luminescence intensity and transfection volume were measured by BLI and BLT at 7 different time points between 2 h after immunization and 22 d after immunization. The decrease of luminescence was associated with the development of antigen-specific immune responses resulting in a strong inverse correlation between immune response and total photon flux (A). The relationship became apparent 3 d post immunization and showed some degree of variation until day 22, when correlation coefficients returned to their values from day 3. Transfected tissue volume (B) correlated directly with immune response 9 d post immunization, with the exception of IFN-γ levels in response to stimulation by recombinant luciferase, which correlated directly with the transfected volume 22 d post immunization. Transfection volume was measured only once during the first 24 h post immunization (Day 1) to reduce the initial exposure of mice to radiation.

Reprints and Corporate Permissions

Please note: Selecting permissions does not provide access to the full text of the article, please see our help page How do I view content?

To request a reprint or corporate permissions for this article, please click on the relevant link below:

Academic Permissions

Please note: Selecting permissions does not provide access to the full text of the article, please see our help page How do I view content?

Obtain permissions instantly via Rightslink by clicking on the button below:

If you are unable to obtain permissions via Rightslink, please complete and submit this Permissions form. For more information, please visit our Permissions help page.