Figures & data
Figure 1. Cloning of murine IL-22 and expression in vitro and vivo; (A) The DNA sequence of IL-22 was cloned by overlap PCR (Lane M: DL2000 markers, Lane 1: the cloned IL-22); (B) 48 h after transfection with pVAX-IL-22, BHK cells and non-transfected cells were intracellularly stained with anti-IL-22-PE and analyzed by FACSCalibur; (C) RNA was extracted from injected mouse muscle on day 3 after primary immunization. The expression of IL-22 gene was quantified by Q-PCR, normalized with GAPDH (**p < 0.01).
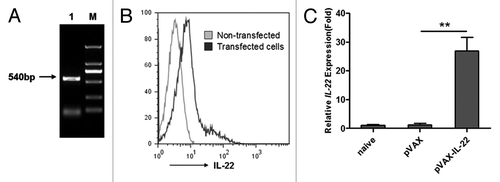
Figure 2. IL-22 as a molecular adjuvant failed to enhance anti-HBsAg humoral response. Sera from immunized mice was collected and pooled 7 d after the third immunization and analyzed by ELISA; (A) Total IgG was quantified with a commercial IgG standard; (B) IgG1 and (C) IgG2a isotypes against HBsAg were quantified against dilutions of standard mouse IgG subtypes. Data shown are representative of three independent experiments (ns, p > 0.05).
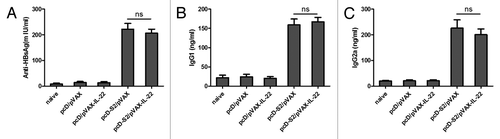
Figure 3. Effect of IL-22 as an adjuvant on antigen-specific cytokine production in CD4+ T cells; (A) Expression of IFN-γ, IL-4 and IL-17 in CD4+ T cells detected after 6 h stimulation in vitro with HBs126–138 (RGLYFPAGGSSSG). T cells were isolated from C57BL/6 mice on day 7 after final immunization. Intracellular staining of IFN-γ, IL-4 and IL-17 in CD4+ T cells was determined by FACS; (B) Summary of the data in panel A (*p < 0.05; ns, p > 0.05).
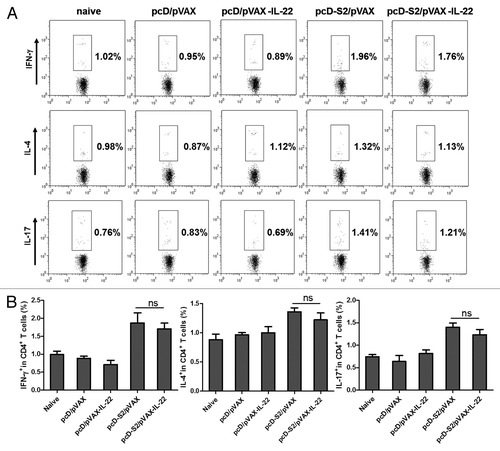
Figure 4. Effects of IL-22 as an adjuvant on antigen-specific cytokine productions in CD8+ T cells; (A) T cells were isolated from C57BL/6 mice on day 7 after final immunization and expression of IFN-γ, and IL-17 in CD8+ T cells was detected after 6h stimulation in vitro with S208–216 (ILSPFLPLL). Intracellular staining of IFN-γ and IL-17 in CD8+ T cells was determined by FACS; (B) Summary of the data in panel A (*p < 0.05; ns, p > 0.05).
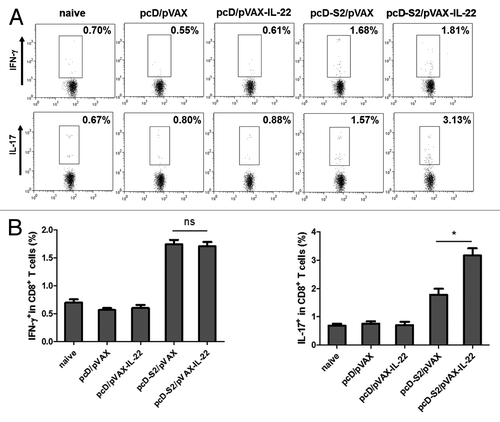
Figure 5. Effects of IL-22 on antigen-specific cytotoxic T lymphocyte responses to HBV DNA vaccination; (A) CFSE-labeled spleen cells were transferred to immunized mice and cytotoxicity was assayed as described in Methods; (B) The percentage of specific lysis, summarized as the means and SEM of the three independent experiments (*p < 0.05).
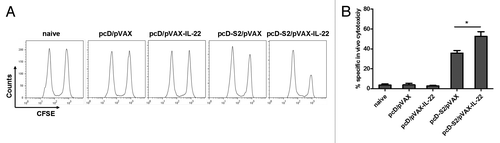
Figure 6. Impairment of antigen-specific cytotoxic T lymphocyte response in CD8 KO mice and IL-17 KO mice. Mice were immunized with HBV DNA vaccine and pVAX-IL-22 plasmid. CTL assay was performed 7 d after the last immunization as described in Methods. The percentage of specific lysis and SEM is shown for (A) CD8 KO mice and wild type mice; (B) IL-17 KO mice and WT mice; (C) IFN-γ KO mice and WT mice. In each case, the results are representative of three independent experiments (*p < 0.05).
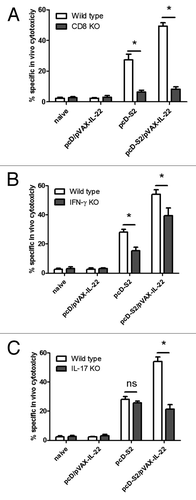
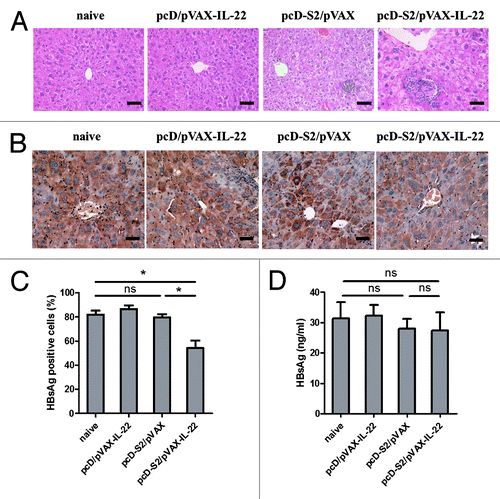
Figure 7. Histopathology of liver and immunochemical staining in HBsAg-transgenic mice; (A) Livers from each group were isolated on day 14 after the final immunization and fixed, sectioned, and then stained with H&E. Bar = 50 μm; (B) Specific immunostaining of HBsAg on day 14 after final immunization. Bar = 50 μm; (C) The percentage of HBsAg-positive hepatocytes was determined by light microscopy; (D) The concentration of HBsAg in sera on day 14 after final immunization was detected by ELISA. There were four mice in each group (* p < 0.05; ns, p > 0.05).