Figures & data
Figure 1. Human islets express both membrane-bound and soluble isoforms of the IL-6R. (A) cDNA was generated from human islet RNA and amplified by RT-PCR using primers spanning exon 10 of the IL-6R [membrane-bound form (IL-6R): 265 bp; soluble form (sIL-6R): 171 bp]. Bands were separated by electrophoresis and visualized under long-wave UV illumination. (B) The identity of amplicons was confirmed by the direct sequencing of each excised band. The sequence of each amplicon is presented, with exon 10 emboldened.
![Figure 1. Human islets express both membrane-bound and soluble isoforms of the IL-6R. (A) cDNA was generated from human islet RNA and amplified by RT-PCR using primers spanning exon 10 of the IL-6R [membrane-bound form (IL-6R): 265 bp; soluble form (sIL-6R): 171 bp]. Bands were separated by electrophoresis and visualized under long-wave UV illumination. (B) The identity of amplicons was confirmed by the direct sequencing of each excised band. The sequence of each amplicon is presented, with exon 10 emboldened.](/cms/asset/2b2ab393-80f8-465c-af09-e5ad66f9f24f/kisl_a_10924249_f0001.gif)
Figure 2. IL-13 treatment protects INS-1E cells against a range of cytotoxic stimuli. Cell death was induced either by incubation of INS-1E cells under serum-free conditions for 96 h (A and B) or with 250 μM palmitate for 48 h (C). (A) Serum deprived cells were either untreated (control) or incubated with IL-13 (20 ng/ml), IL-4 (2 ng/ml) or both cytokines together. (B) Serum deprived cells were treated with increasing concentrations of IL-13 (0–20 ng/ml). (C) For fatty acid experiments, cells were treated with IL-13 (20 ng/ml) prior to incubation with palmitate. In all cases, the viability of cells was measured by flow cytometry using PI staining. (A and C) Data represent mean values ± SEM (n = 3), ***p < 0.001, **p < 0.01 as indicated. (B) Data are presented as mean values ± SEM from a representative experiment (n = 6) which was repeated with similar results.
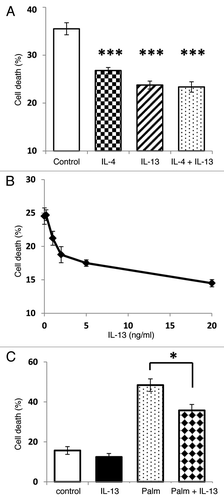
Figure 3. The PI-3K/Akt signal transduction pathway is not involved in IL-13 mediated cytoprotection. INS-1E cells were either untreated or stimulated with IL-13 (20 ng/ml). Following treatment, total protein was extracted, and the protein concentration equalised to 50 μg. The levels of pJak2 and β-actin were determined by Western blotting. (A) Blots are representative of three separate experiments. (B) The intensity of bands was measured by densitometry, with pJak2 expressed relative to β-actin. Data are presented as the mean values from three separate experiments, **p < 0.01 relative to control. (C) INS-1E cells were incubated under serum starved conditions for 96 h alone (control) or in the presence of IL-13 (20 ng/ml), wortmannin (500 nM) or IL-13 + wortmannin. After treatment, the viability of cells was measured by flow cytometry following PI staining. Data represent mean values ± SEM (n = 3), ***p < 0.001 relative to wortmannin alone.
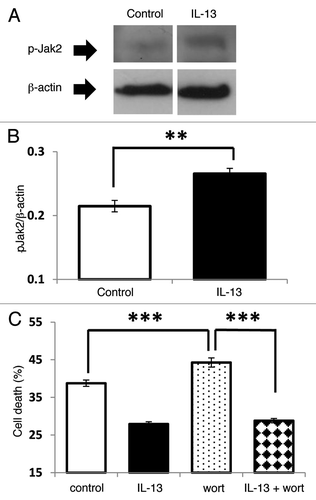
Figure 4. STAT6 and STAT3 are phosphorylated in response to IL-13 in both INS-1E cells and human islets. (A and C) INS-1E cells were treated with IL-13 (20 ng/ml) over a time-course of 240 min. (B and D) Human islets were also exposed to IL-13 (20 ng/ml) for 30 min. After treatment, total protein was extracted, and the protein concentration equalized to either (A) 50 μg, (B) 10 μg, (C) 100 μg or (D) 30 μg per well. The expression levels of (A and B) pSTAT6 and total STAT6 or (C and D) pSTAT3 and total STAT3 were determined by western blot. (A) Lower dotted arrow indicates 105 kDa, middle is approximately 150 kDa and upper is around 200 kDa. (A–D) Data are representative of at least three separate experiments. (E and F) A series of blots comparing untreated (control) INS-1E cells with those exposed to IL-13 (20 ng/ml) for 30 min were analyzed by densitometry and pSTAT expressed relative to total STAT [(E) STAT6, n = 7; (F) STAT3, n = 6]. (G) Representative blots were also analyzed by densitometry and pSTAT expressed relative to total STAT over time. **p < 0.01, *p < 0.05 as indicated.
![Figure 4. STAT6 and STAT3 are phosphorylated in response to IL-13 in both INS-1E cells and human islets. (A and C) INS-1E cells were treated with IL-13 (20 ng/ml) over a time-course of 240 min. (B and D) Human islets were also exposed to IL-13 (20 ng/ml) for 30 min. After treatment, total protein was extracted, and the protein concentration equalized to either (A) 50 μg, (B) 10 μg, (C) 100 μg or (D) 30 μg per well. The expression levels of (A and B) pSTAT6 and total STAT6 or (C and D) pSTAT3 and total STAT3 were determined by western blot. (A) Lower dotted arrow indicates 105 kDa, middle is approximately 150 kDa and upper is around 200 kDa. (A–D) Data are representative of at least three separate experiments. (E and F) A series of blots comparing untreated (control) INS-1E cells with those exposed to IL-13 (20 ng/ml) for 30 min were analyzed by densitometry and pSTAT expressed relative to total STAT [(E) STAT6, n = 7; (F) STAT3, n = 6]. (G) Representative blots were also analyzed by densitometry and pSTAT expressed relative to total STAT over time. **p < 0.01, *p < 0.05 as indicated.](/cms/asset/108fe2e0-6eb5-4772-8e45-0834eb63f117/kisl_a_10924249_f0004.gif)
Figure 5. IL-13 mediates cytoprotection via a Jak/STAT dependent pathway. (A) INS-1E cells were pre-incubated with increasing concentrations of P6 (0–100 nM) prior to a 30 min exposure to IL-13 (20 ng/ml). Protein was extracted, and the concentration of each sample equalised (25 μg) before expression of pSTAT6, STAT6, pSTAT3 and STAT3 were determined by Western blotting. Data are representative of two separate experiments. (B and C) Cells were grown under serum deprived conditions for 96 h and left untreated (serum free) or exposed to either (B) 100 nM P6, 20 ng/ml IL-13 or IL-13 + P6 or (C) 1 μM Jak2 inhibitor, 20 ng/ml IL-13 or IL-13 + Jak2 inhibitor. The viability of cells was then monitored by flow cytometry after PI staining. Data represent mean values ± SEM (n = 3), ***p < 0.001 relative to IL-13 alone.
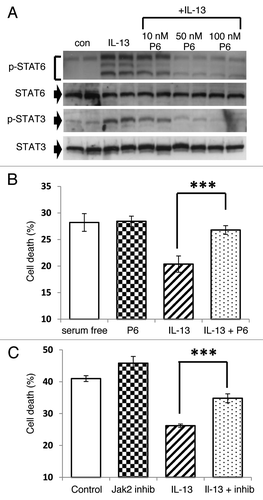
Figure 6. IL-6 potentiates the cytotoxic effects of pro-inflammatory cytokines, serum deprivation and a saturated fatty acid. The viability of INS-1E cells or the formation of nitrite were induced by (A) 96 h serum deprivation; (B) incubation with a pro-inflammatory cytokine mix (pro-inf: 20 ng/ml of IL-1β, TNFα and IFNγ) for 48 h; (C and D) treatment with IL-1β (20 ng/ml) for 48 h; or (E) exposure to palmitate (250 μM) for 48 h. In all cases, cells were also incubated in the absence or presence of IL-6 (20 ng/ml) as shown. Cell viability was determined by flow cytometry after PI staining while nitrite was measured by the Griess assay. Data represent mean values ± SEM (n = 3–4), ***p < 0.001 as indicated.

Figure 7. STAT3 and STAT6 become phosphorylated in response to IL-6 treatment. (A and B) INS-1E cells were treated with IL-6 (20 ng/ml) over a 4-h time-course or alternatively (C) with IL-6 for 15 min or IL-13 (20 ng/ml) for 30 min. (D) Human islets were treated with IL-6 or IL-13 (20 ng/ml) for 30 min. After treatment total protein was extracted, and the protein concentration equalized to either (A) 50 μg, (C) 40 μg or (D) 15 μg per well. Levels of pSTAT3, STAT3, pSTAT6 and STAT6 were determined by western blotting. (A, C and D) Data are representative of at least two separate experiments. (B) The intensity of immunoreactive bands was determined by densitometry and the generation of pSTAT expressed relative to total STAT for each isoform.
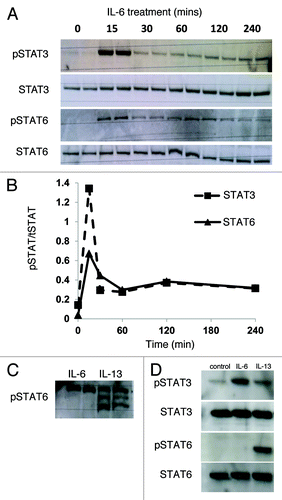
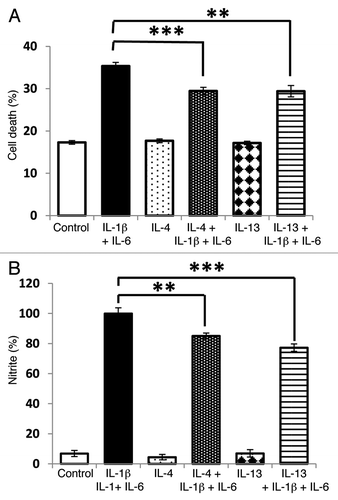
Figure 8. Potentiation of cytokine induced cytotoxicity by IL-6 is sensitive to IL-13. INS-1E cells were pre-incubated with IL-13 (20 ng/ml) or IL-4 (20 ng/ml) for 48 h before exposure to IL-1β (20 ng/ml) and IL-6 (20 ng/ml) for a further 48 h. Following treatment, cell viability was measured by flow cytometry (A), and nitrite synthesis was assessed by the Griess assay (B). Data represent mean values ± SEM (n = 3), **p < 0.01, ***p < 0.001 as indicated.