Figures & data
Figure 2 The catumaxomab sample was analyzed using RP-HPLC mass spectrometry using a PLRP-S column (Varian) with an acetonitrile gradient from 27% to 42% over 40 minutes on a 1200 HPLC system (Agilent) for separation, coupled with an Agilent 6220 ESI-TOF mass spectrometer. The column temperature was 65°C and the flow rate was 200 µL/min. (A) Combined raw spectrum of approximately 60 scans (1 minute) at a resolution of approximately 14,000. (B) The raw data was converted using MassHunter deconvolution software.
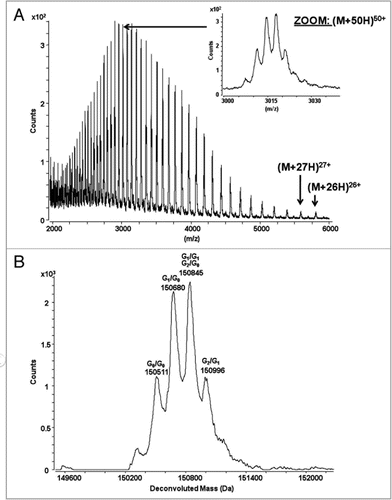
Figure 3 Reversed-phase chromatogram with UV absorbance at 214 nm of the reduced antibody. The catumaxomab sample was denatured using 6 M guanidine, reduced with DTTand alkylated using iodoaceteamide. The reduced and alkylated antibody chains were separated on a PLRP-S column (Varian) using an acetonitrile gradient from 27% to 42% over 40 minutes on a 1200 HPLC system (Agilent) coupled with an Agilent 6220 ESI-TOF mass spectrometer. The column temperature was 65°C and the flow rate was 200 µL/min. The raw mass spectra of the 4 antibody chains were converted using MassHunter deconvolution software for the calculation of the observed masses (see ).
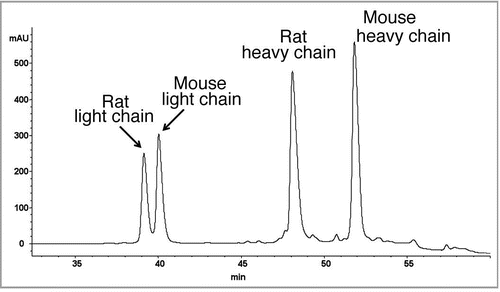
Figure 4 Fluorescence spectroscopy was carried out in a Fluoromax-2 spectrometer with a path length of 1 cm. Emission spectra of the samples were recorded at a temperature of 20°C in the range of 300–450 nm with an excitation wavelength of 295 nm. The slits for excitation were 5 nm and for emission 10 nm. The catumaxomab sample was diluted to 0.24 mg/ml with sample buffer (native sample shown as solid line). Samples were denatured in 6 M guanidine hydrochloride (denatured sample shown as dashed line). Samples, which had to be reduced in addition, were incubated with DTT at a final concentration of 20 mM (denatured and reduced samples is shown as dotted line). For complete denaturation, samples were incubated for 2 hours at room temperature.
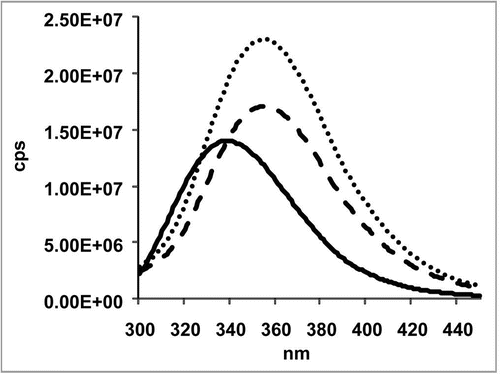
Figure 5 Far-UV CD spectrum (A), near-UV CD spectrum (B) and the thermal transition spectrum (C) of a catumaxomab sample. All spectra were recorded in a Jasco 715 CD-spectropolarimeter at 20°C. The spectra are average values of 15 accumulated measurements. The Y-axis represents the mean residual weight ellipticity in degree x cm-2 x dmol-1. (A) The path length of the cuvette was 0.1 cm for the far-UV spectra and 0.5 cm for near-UV spectra. (B) Near-UV spectra were measured with a protein concentration of 0.6 mg/ml from 250–340 nm, far-UV spectra with a concentration of 0.3 mg/ml between 190–260 nm. (A and B) Near- and far-UV spectra were measured exclusively in PBS buffer. The secondary structure content was calculated for the far-UV-spectra using CDNN.Citation45 (C) Thermal transitions were recorded in a Jasco 715 CD-spectropolarimeter at 220 nm. The path length of the cuvette was 0.1 cm. The experiments were performed with a constant heating rate of 15°C/h from 20°C to 80°C with a protein concentration of 0.2 mg/ml.
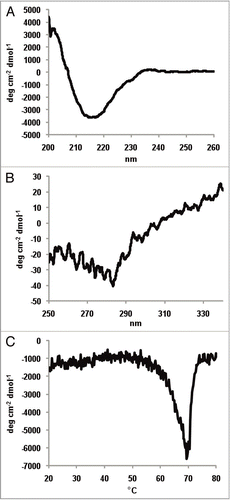
Figure 6 Exemplary samples of trifunctional binding of catumaxomab to CD3, EpCAM and FcγR on the target cells Jurkat, HCT-8 and THP-1. Antibody binding was assessed by flow cytometry at catumaxomab concentrations of 1.2–1.6 µg/ml. Negative controls were performed in the absence of catumaxomab (filled histograms). Cell bound catumaxomab was detected via phycoerythrin (PE) labelled goat anti-mouse IgG (Jurkat cells) or goat-anti-rat IgG (HCT-8 cells) secondary detection antibodies. For THP-1 cells F(ab′)2 fragments of PE-labelled donkey-anti-rat IgG were used to avoid binding interference of secondary detection antibody with FcγR.
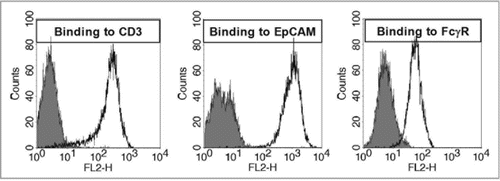
Figure 7 Dose response curve of catumaxomab mediated lysis of HCT-8 tumor cells using three different PBMC donors. The allogeneic cytotoxicity bioassay was performed as described previously.Citation48 Approaches were carried out in duplicates and five parameter curve fitting of dose response curves was executed by Prism Software version 5.02 (Graph Pad Software, San Diego, CA).
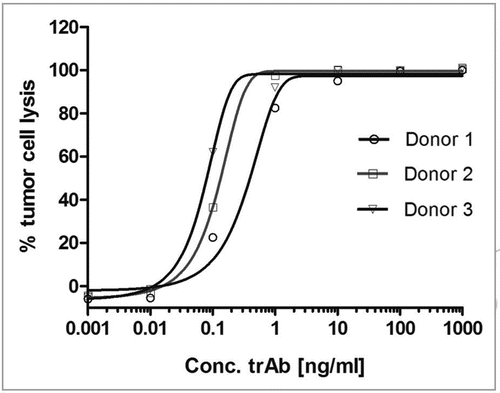
Table 1 The intact antibody and the reduced antibody samples were analyzed by LC/MS observed masses were calculated from the raw data using the MassHunter deconvolution algorithm.
Table 2 The antibody sample was enzymatically cleaved using Lys-C followed by reduction (DTT) and alkylation (iodoacetamide). The resulting peptides were separated on a C5 reversed-phase column (Phenomenex) using an acetonitrile gradient from 0% to 50% over 127 minutes on a 1200 HPLC system (Agilent) and analyzed by mass spectrometry using an ESI TOF (Agilent 6220) mass spectrometer. The amounts of the different glycoforms were calculated from the ion intensities of the most abundant charge state. PNGase released glycans were analyzed by HPAEC-PAD on a CarboPac PA1 column using a DX 500 system (Dionex) equipped with an ED40 detector.
Table 3 Far UV-CD spectra were recorded using a jasco 715 CD-spectropolarimeter from 190 to 260 nm at 20°C and accumulated 15 times in PBS-buffer (). The protein concentration was 0.321 mg/ml. The analysis of the secondary structure was performed with the CD deconvolution software CDNN.Citation45
Table 4 Percentage of aggregates measured using SEC, AUC and FFF technologies. SEC was performed on a TSK gel G3000 SWXL column (Tosoh Bioscience LLC) using an Agilent 1100 HPLC system. the AUC experiments were performed on a Optima XL-A Beckman analytical ultracentrifuge (Beckman) equipped with an absorption optical system, an 8-hole analytical rotor An-50-Ti, and centrifuge cells with quartz windows and 2-channel charcoal filled centerpieces with an optical path length of d = 1.2 cm. using a centrifugation speed of 42,000 rpm. The data was analyzed using SEDFIT algorithm.Citation57 FFF was performed on a Eclipse 2 (Wyatt) system using a 10 kDa cellulose membrane (control sample) or on a AF2000 FOCUS system (Postnova) using a PES 4 kDa membrane (stressed and in-process sample). the stressed sample was generated by incubation at 37°C and the in-process sample was from an protein-A purification step.
