Figures & data
Figure 1. Enthalpograms for the titration of 10 mM Tween 80 into 14.4 mg/mL (0.24 mM) BSA (A), and 10 mM Tween 80 into 14.4 mg/mL mAb-1 (B). Top panels show power flow signals for each injection of polysorbate into the protein solution. Bottom panels show the reaction enthalpies as determined by peak integration.
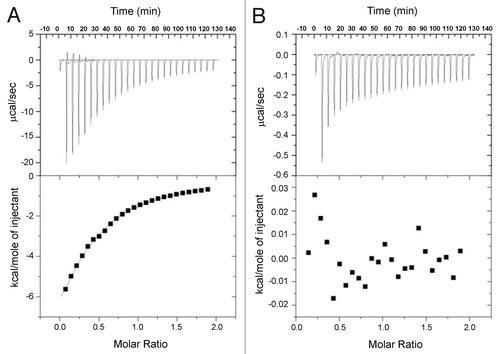
Figure 2. TIRF data showing linear relationships for the rate of adsorption of mAb-1 to the glass surface vs. its concentration for a constant shear of 6 sec−1 (A), and the cube root of the shear rate for a mAb-1 concentration of 0.01 mg/mL (B), according to the Leveque equation.
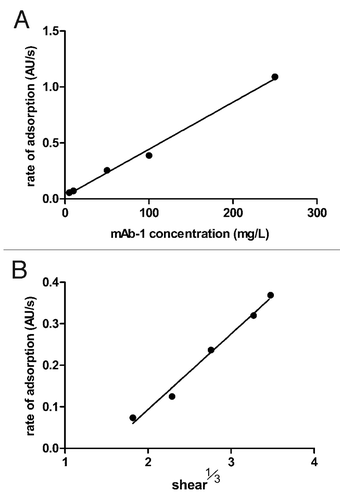
Figure 3. Adsorption of a 0.01 mg/mL solution of mAb-1 to a glass surface (black line), investigated using TIRF, followed by introduction of polysorbate (arrow) in PBS pH 7.4 as follows: Tween 20, 0.05 mM (red line) and 1 mM (gray line); Tween 80, 5 µM (blue line) and 1 mM (green line).
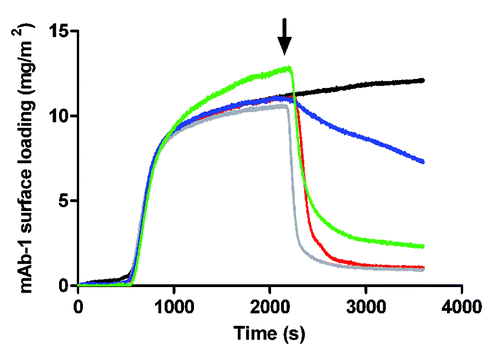
Figure 4. Adsorption of a 0.01 mg/mL solution of mAb-1 co-dissolved with polysorbate to a glass surface in PBS pH 7.4, investigated using TIRF, as follows: Tween 20, 0.05 mM (red line) and 1 mM (gray line); Tween 80, 5 µM (blue line) and 1 mM (green line). Reference was to the adsorption of a 0.01 mg/mL solution of mAb-1 to a glass surface (black line).
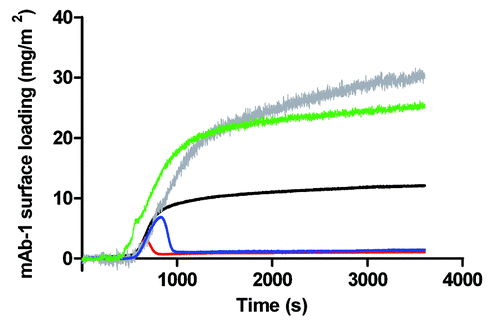
Figure 5. Adsorption of a 0.01 mg/mL solution of mAb-1 to a glass surface pre-coated with polysorbate in PBS buffer pH 7.4, investigated using TIRF, as follows: Tween 20, 0.05 mM (red line) and 1 mM (gray line); Tween 80, 5 µM (blue line) and 1 mM (green line). Reference was to the adsorption of a 0.01 mg/mL solution of mAb-1 to a glass surface (black line).
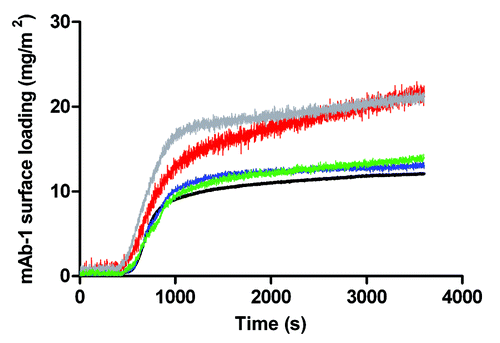
Figure 6. Adsorption of a 0.01 mg/mL solution of mAb-1 histidine buffer pH 5.5 to a glass surface (gray line) and to an OTS-coated (hydrophobized) glass surface (black line), investigated using TIRF.
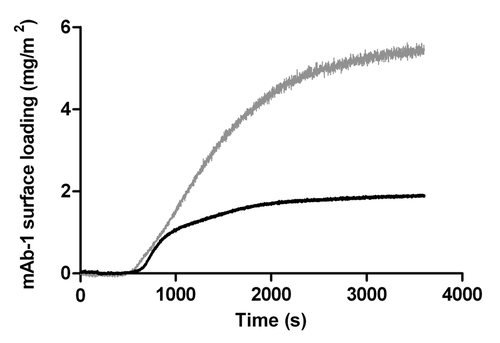
Figure 7. Adsorption of a 0.01 mg/mL solution of mAb-1 to an OTS-coated glass surface (black line), investigated using TIRF, followed by introduction polysorbate (arrow) in histidine buffer pH 5.5 as follows: Tween 20, 0.05 mM (red line) and 1 mM (gray line); Tween 80, 5 µM (blue line) and 1 mM (green line).
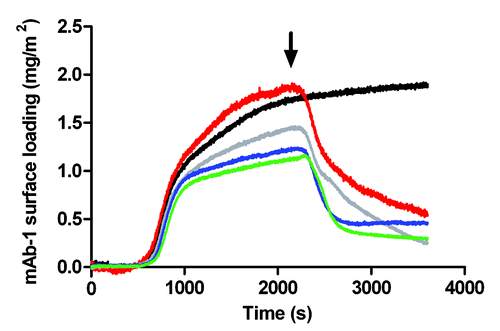
Figure 8. Adsorption of a 0.01 mg/mL solution of mAb-1 to an OTS-coated glass surface pre-coated with polysorbate in histidine buffer pH 5.5, investigated using TIRF, as follows: Tween 20, 0.05 mM (red line) and 1 mM (gray line); Tween 80, 5 µM (blue line) and 1 mM (green line). Referenced to the adsorption of a 0.01 mg/mL solution of mAb-1 to a OTS-coated glass surface (black line).
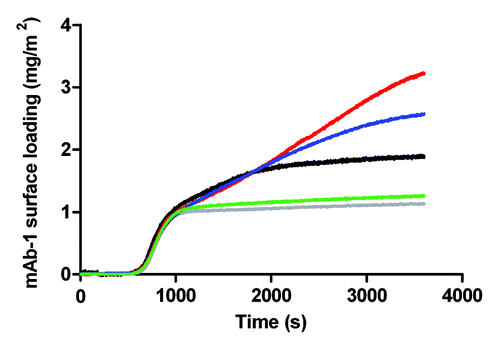
Figure 9. Neutron reflectivity profiles for mAb-1 adsorbed to a SiO2 (A) and OTS-coated SiO2 (B) surface at bulk concentrations of 50 (black), 200 (gray), 500 (red), 2000 (green) and 5000 (blue) mg/ml in histidine buffer pH 5.5. Data points are shown as empty circles, with the fitted reflectivity profiles shown as solid lines in the same color. For clarity, reflectivity profiles for increasing bulk concentrations are sequentially offset in the ordinate by a factor of log100.5.
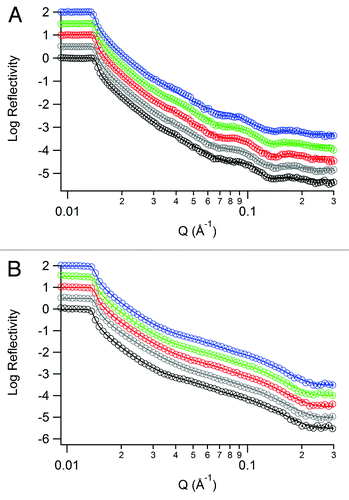
Figure 10. Fitted SLD profiles for neutron reflectivity data for mAb-1 adsorbed to SiO2 from solutions in histidine pH 5.5 (A) or PBS pH 7.4 (B), and to OTS-coated SiO2 from solutions in histidine pH 5.5 (C). Profiles are shown as the distance from the silicon-SiO2 interface and labels are used as a guide for the SLD of each layer, corresponding to .
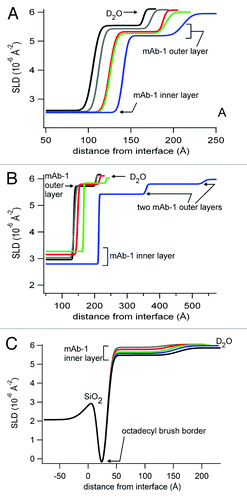
Table 1. Fitted layer parameters for one-, two- and three-layer models of mAb-1 adsorbed to the SiO2 and OTS-coated SiO2 surface.
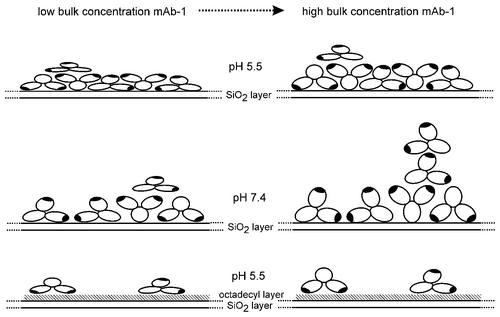
Figure 11. Cartoon of the change in surface fraction and molecular orientation (layer thickness) for the adsorption mAb-1 to SiO2 and OTS-coated SiO2 with increasing bulk concentration at pH 7.4 and 5.5.