1,818
Views
21
CrossRef citations to date
0
Altmetric
Report

Antagonist properties of monoclonal antibodies targeting human CD28

Role of valency and the heavy-chain constant domain

, , , , , & show all
Pages 47-55 | Published online: 05 Dec 2012

Figures & data

Figure 1. Schematics of the antibodies used in this study, all derived from the CD28.3 anti-human CD28 mAb. IgG1, murine original mAb in its divalent IgG1 format. F(ab’)2, product of the pepsin digestion of the CD28.3 mAb. MF280, novel monovalent construction consisting in a chimeric heterodimer of VH-CH2-CH3 and VL-CH2-CH3 chains. Fab’, humanized recombinant antibody fragment produced in CHO cell supernatant. Sc28AT, recombinant fusion antibody consisting in the assembly of a scFv with human α-1-antitrypsin. FR104, humanized Fab’ modified by pegylation with a 2 x 20 kDa polyethylene glycol moiety branched at the c-terminal end of the heavy chain.
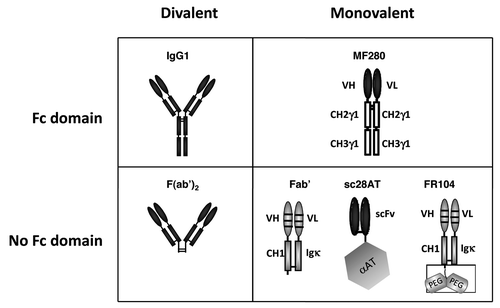
Figure 1. Schematics of the antibodies used in this study, all derived from the CD28.3 anti-human CD28 mAb. IgG1, murine original mAb in its divalent IgG1 format. F(ab’)2, product of the pepsin digestion of the CD28.3 mAb. MF280, novel monovalent construction consisting in a chimeric heterodimer of VH-CH2-CH3 and VL-CH2-CH3 chains. Fab’, humanized recombinant antibody fragment produced in CHO cell supernatant. Sc28AT, recombinant fusion antibody consisting in the assembly of a scFv with human α-1-antitrypsin. FR104, humanized Fab’ modified by pegylation with a 2 x 20 kDa polyethylene glycol moiety branched at the c-terminal end of the heavy chain.

Figure 2. Binding analysis of anti-CD28 antibodies. (A) Assessment by ELISA on immobilized CD28-Fc of MF280 (Δ), sc28AT (●), Fab’ (■), FR104 (◊), F(ab)’2 (▲) and IgG (+). Revelation was performed with a rabbit antibody against VH/VL domains of the CD28.3 mAb plus peroxidase-labeled goat anti-rabbit antibodies and revealed by colorimetry at 450nm using TMB substrate. ED50 is the concentration of the indicated antibody to reach 50% of the signal in this assay. One experiment representative of three is shown. (B) Assessment of binding by flow cytometry on target Jurkat T cells of indicated antibodies at 200 nM (gray-tinted, black line), 100 nM (black dotted line), 20 nM (light-gray-tinted, gray line) and without antibody (solid black line).
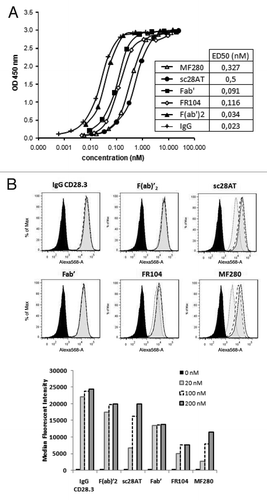
Figure 2. Binding analysis of anti-CD28 antibodies. (A) Assessment by ELISA on immobilized CD28-Fc of MF280 (Δ), sc28AT (●), Fab’ (■), FR104 (◊), F(ab)’2 (▲) and IgG (+). Revelation was performed with a rabbit antibody against VH/VL domains of the CD28.3 mAb plus peroxidase-labeled goat anti-rabbit antibodies and revealed by colorimetry at 450nm using TMB substrate. ED50 is the concentration of the indicated antibody to reach 50% of the signal in this assay. One experiment representative of three is shown. (B) Assessment of binding by flow cytometry on target Jurkat T cells of indicated antibodies at 200 nM (gray-tinted, black line), 100 nM (black dotted line), 20 nM (light-gray-tinted, gray line) and without antibody (solid black line).

Table 1. Surface plasmon resonance analysis of interaction with recombinant CD28

Figure 3. CD28 capping induction by anti-CD28 antibodies. (A) Jurkat T cells expressing CD28 were incubated for 1h with 20µg/ml of indicated antibodies at 0 or 37°C. After washing, cells were fixed in 0.5% paraformaldehyde, centrifuged onto glass slides, immunolabeled with anti-CD28.3 VH/VL antibodies plus FITC-labeled donkey anti-rabbit antibodies and examined by epifluorescence.
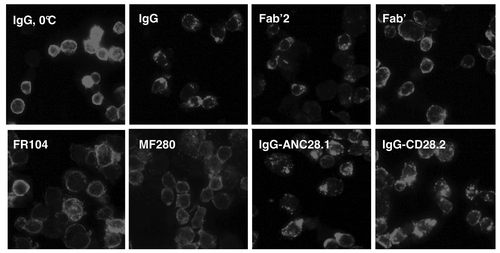
Figure 3. CD28 capping induction by anti-CD28 antibodies. (A) Jurkat T cells expressing CD28 were incubated for 1h with 20µg/ml of indicated antibodies at 0 or 37°C. After washing, cells were fixed in 0.5% paraformaldehyde, centrifuged onto glass slides, immunolabeled with anti-CD28.3 VH/VL antibodies plus FITC-labeled donkey anti-rabbit antibodies and examined by epifluorescence.

Figure 4. Activation of PI3K pathway with divalent or monovalent anti-CD28 mAbs. (A) Expression of Phospho-PI3K, total PI3K and GAPDH was assessed by Western Blot in lysate of Jurkat T cells stimulated 5 min. at 37°C with 10 µg/ml of each indicated mAb in the liquid phase plus immobilized anti-CD3 antibodies. Results are representative of 4 independent experiments.
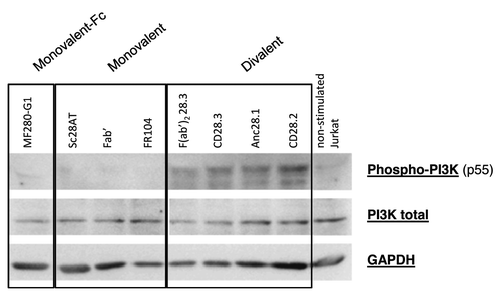
Figure 4. Activation of PI3K pathway with divalent or monovalent anti-CD28 mAbs. (A) Expression of Phospho-PI3K, total PI3K and GAPDH was assessed by Western Blot in lysate of Jurkat T cells stimulated 5 min. at 37°C with 10 µg/ml of each indicated mAb in the liquid phase plus immobilized anti-CD3 antibodies. Results are representative of 4 independent experiments.

Figure 5. Agonist or antagonist properties of anti- CD28 antibodies. (A) IL-2 secretion by Jurkat T cells stimulated for 2 d with SEE superantigens presented by Raji B cells, after addition of 10 µg/ml of the indicated mAb. (B) Mixed-lymphocyte reactions measured after 5 d with human PBMC and addition of MF280 (■), FR104 (x), F(ab)’2 (Δ), IgG CD28.3 (o) and IgG CD28.2 (▼) at different concentrations. (C) Proliferation of human PBMC maintained for 3 d in culture wells coated with anti-CD3 antibodies, and in the presence of 10 µg/ml of indicated mAbs in the liquid phase. (D and E) TNFα and (E) IFNγ cytokines were measured after 24h in the supernatant of PBMC stimulated as in condition C. Data were mean ± SEM of three experiments. *p < 0.05, **p < 0.01, ***p < 0.001. ns, not significant.
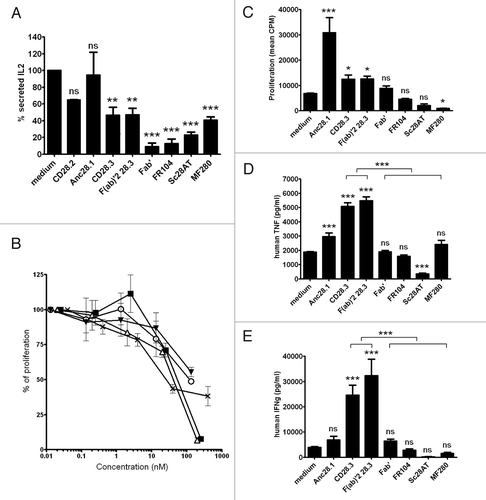
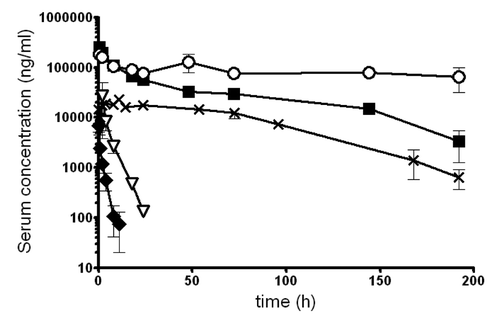
Figure 5. Agonist or antagonist properties of anti- CD28 antibodies. (A) IL-2 secretion by Jurkat T cells stimulated for 2 d with SEE superantigens presented by Raji B cells, after addition of 10 µg/ml of the indicated mAb. (B) Mixed-lymphocyte reactions measured after 5 d with human PBMC and addition of MF280 (■), FR104 (x), F(ab)’2 (Δ), IgG CD28.3 (o) and IgG CD28.2 (▼) at different concentrations. (C) Proliferation of human PBMC maintained for 3 d in culture wells coated with anti-CD3 antibodies, and in the presence of 10 µg/ml of indicated mAbs in the liquid phase. (D and E) TNFα and (E) IFNγ cytokines were measured after 24h in the supernatant of PBMC stimulated as in condition C. Data were mean ± SEM of three experiments. *p < 0.05, **p < 0.01, ***p < 0.001. ns, not significant.

Figure 6. Pharmacokinetic of anti-CD28 mAbs in mice. Four mg/kg of each indicated mAb, MF280 (■), Sc28AT (∇), Fab’ (♦), FR104 (x) and IgG CD28.3 (o), was injected i.v. in bolus. Concentration in the serum was measured over time by ELISA. Data shown here were mean of 5 mice.

Figure 6. Pharmacokinetic of anti-CD28 mAbs in mice. Four mg/kg of each indicated mAb, MF280 (■), Sc28AT (∇), Fab’ (♦), FR104 (x) and IgG CD28.3 (o), was injected i.v. in bolus. Concentration in the serum was measured over time by ELISA. Data shown here were mean of 5 mice.

Reprints and Corporate Permissions

Please note: Selecting permissions does not provide access to the full text of the article, please see our help page How do I view content?

To request a reprint or corporate permissions for this article, please click on the relevant link below:

Academic Permissions

Please note: Selecting permissions does not provide access to the full text of the article, please see our help page How do I view content?

Obtain permissions instantly via Rightslink by clicking on the button below:

If you are unable to obtain permissions via Rightslink, please complete and submit this Permissions form. For more information, please visit our Permissions help page.