2,319
Views
54
CrossRef citations to date
0
Altmetric
Report

Structural analysis of a therapeutic monoclonal antibody dimer by hydroxyl radical footprinting

, , , , &
Pages 86-101 | Published online: 17 Dec 2012

Figures & data

Figure 1. SEC chromatograms of enriched fractions. IgG1 bulk drug substance starting material contains approximately 4% dimer. Enriched dimer is 92% pure, and enriched monomer is 96% pure.
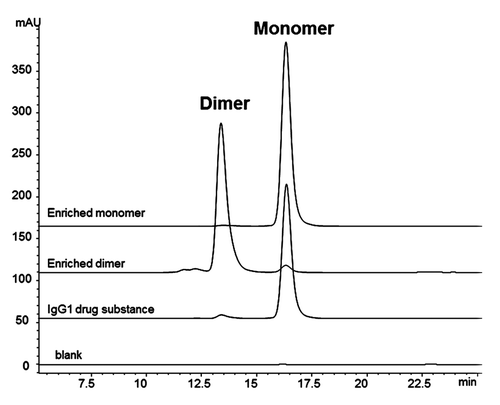
Figure 1. SEC chromatograms of enriched fractions. IgG1 bulk drug substance starting material contains approximately 4% dimer. Enriched dimer is 92% pure, and enriched monomer is 96% pure.

Table 1. Characterization data for SEC-enriched IgG1 dimer and monomer samples

Figure 2. Fragment-SEC chromatograms of papain-digested dimer and monomer. (A) Papain digest of dimer and monomer. Peak 1 is a Fab/Fab associated species, Peak 2 is intact disulfide-linked Fc, and Peak 3 is the monomeric Fab (). (B) Papain digest incubation time course study of the dimer. Peak 1 (Fab/Fab species) increases with incubation time, while Peak 3 (Fab) decreases. Peak 2 (intact Fc) remains constant. (C) Papain digest incubation time course study of the monomer. Peak 1 (Fab/Fab species) increases with incubation time, while Peak 3 (Fab) decreases. Peak 2 is unchanged.
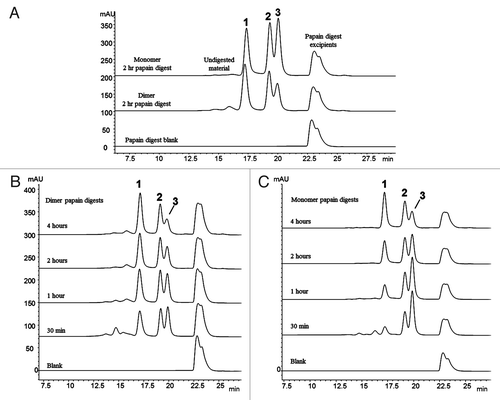
Figure 2. Fragment-SEC chromatograms of papain-digested dimer and monomer. (A) Papain digest of dimer and monomer. Peak 1 is a Fab/Fab associated species, Peak 2 is intact disulfide-linked Fc, and Peak 3 is the monomeric Fab (Table 2). (B) Papain digest incubation time course study of the dimer. Peak 1 (Fab/Fab species) increases with incubation time, while Peak 3 (Fab) decreases. Peak 2 (intact Fc) remains constant. (C) Papain digest incubation time course study of the monomer. Peak 1 (Fab/Fab species) increases with incubation time, while Peak 3 (Fab) decreases. Peak 2 is unchanged.

Table 2. Characterization data for papain-generated fragments

Figure 3. Fragment-SEC chromatograms of FabRICATOR®-digested dimer and monomer. FabRICATOR® digest of dimer and monomer samples. Peak 1 is a Fabʹ2/Fabʹ2 associated species, Peak 2 is monomeric Fabʹ2, and Peak 3 is an Fc/Fc fragment species. Peak 1 is only prominent in the dimer sample. Peak 3 is equally present in both the dimer and monomer sample. Refer to for characterization data for FabRICATOR®-generated fragments.

Figure 3. Fragment-SEC chromatograms of FabRICATOR®-digested dimer and monomer. FabRICATOR® digest of dimer and monomer samples. Peak 1 is a Fabʹ2/Fabʹ2 associated species, Peak 2 is monomeric Fabʹ2, and Peak 3 is an Fc/Fc fragment species. Peak 1 is only prominent in the dimer sample. Peak 3 is equally present in both the dimer and monomer sample. Refer to Table 3 for characterization data for FabRICATOR®-generated fragments.

Table 3. Characterization data for FabRICATOR®-generated fragments

Table 4A. Summary of oxidized heavy chain tryptic peptide data

Table 4B. Summary of oxidized light chain tryptic peptide data

Figure 4. Examples of dose response curves and rate constants for oxidized tryptic peptides. Data generated by ProtMap MS software. Linear curves reflect the pseudo first order reaction kinetics of the hydroxyl radical oxidation. Rate constants (k) are also calculated by the software. Blue lines are point-to-point plots of the rate constants (k) at each exposure time. Red lines represent the lines of best fit.
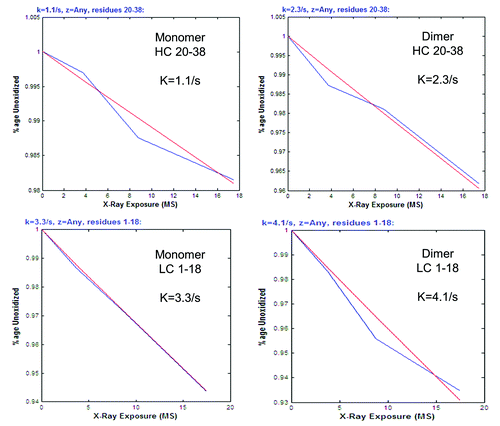
Figure 4. Examples of dose response curves and rate constants for oxidized tryptic peptides. Data generated by ProtMap MS software. Linear curves reflect the pseudo first order reaction kinetics of the hydroxyl radical oxidation. Rate constants (k) are also calculated by the software. Blue lines are point-to-point plots of the rate constants (k) at each exposure time. Red lines represent the lines of best fit.

Figure 5. Bar graphs of corrected rate constant ratios (dimer:monomer). (A) Corrected rate constant (k) ratios of heavy chain tryptic peptides (). (B) Corrected rate constant (k) ratios of light chain tryptic peptides (). For both panels, yellow bars indicate peptides with decreased protection in the dimer. Green bars indicate peptides with increased protection in the dimer. Uncolored bars indicate peptides that show no relative difference in protection levels between the dimer and monomer.
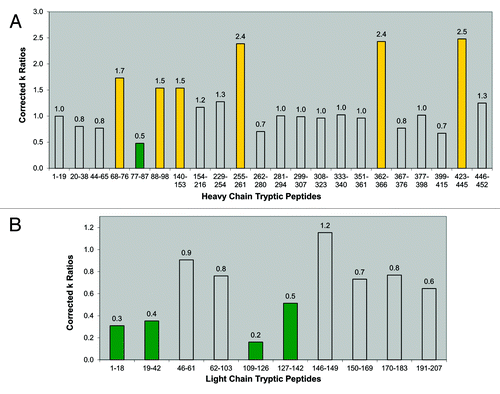
Figure 5. Bar graphs of corrected rate constant ratios (dimer:monomer). (A) Corrected rate constant (k) ratios of heavy chain tryptic peptides (Table 4A). (B) Corrected rate constant (k) ratios of light chain tryptic peptides (Table 4B). For both panels, yellow bars indicate peptides with decreased protection in the dimer. Green bars indicate peptides with increased protection in the dimer. Uncolored bars indicate peptides that show no relative difference in protection levels between the dimer and monomer.

Figure 6. IgG1 homology structure with mapped protection levels. (A) Model of IgG1 constructed using 1BJ1 and 1IGY crystal structures. Colored according to the relative protection levels derived from oxidative labeling. Yellow indicates regions with decreased protection in the dimer. Green indicates regions with increased protection in the dimer. Uncolored areas indicate regions which show no relative difference in protection levels between the dimer and monomer. The blue region represents the Asn-linked Fc glycans typically found in IgG1 therapeutic mAbs. (B) Space-filled cartoon model of the IgG1 with the heavy chains colored purple and light chains colored red. The light chains of an IgG1 are on opposite planes with respect with each other. The heavy chains in the Fab region are also on opposite planes.
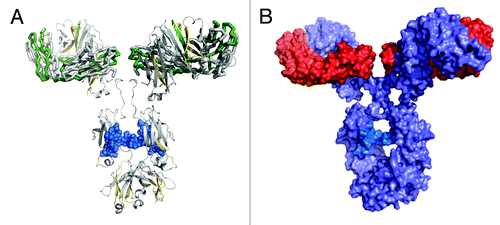
Figure 6. IgG1 homology structure with mapped protection levels. (A) Model of IgG1 constructed using 1BJ1 and 1IGY crystal structures. Colored according to the relative protection levels derived from oxidative labeling. Yellow indicates regions with decreased protection in the dimer. Green indicates regions with increased protection in the dimer. Uncolored areas indicate regions which show no relative difference in protection levels between the dimer and monomer. The blue region represents the Asn-linked Fc glycans typically found in IgG1 therapeutic mAbs. (B) Space-filled cartoon model of the IgG1 with the heavy chains colored purple and light chains colored red. The light chains of an IgG1 are on opposite planes with respect with each other. The heavy chains in the Fab region are also on opposite planes.

Figure 7. Proposed possible orientations of the IgG1 dimer. Cartoon representations of proposed possible dimer orientations based on the hydroxyl radical footprinting data. The bottom mAb has heavy chains in gray and light chains in black. The top mAb has heavy chains in light blue and light chains in dark blue. Head-to-head orientation allows for the light and heavy chains of the dimer to associate with each other in the interface region. (A) Cartoon depiction of a head-to head, a single-arm bound Fab-to-Fab dimer. (B) Cartoon depiction of a head-to head, double arm-bound Fabʹ2-to-Fabʹ2 dimer.
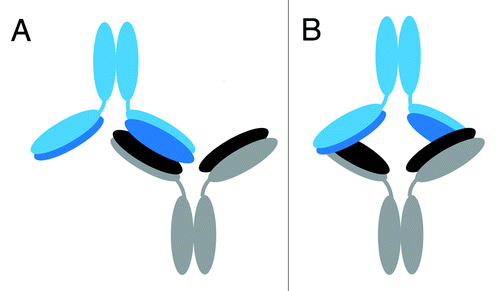
Figure 7. Proposed possible orientations of the IgG1 dimer. Cartoon representations of proposed possible dimer orientations based on the hydroxyl radical footprinting data. The bottom mAb has heavy chains in gray and light chains in black. The top mAb has heavy chains in light blue and light chains in dark blue. Head-to-head orientation allows for the light and heavy chains of the dimer to associate with each other in the interface region. (A) Cartoon depiction of a head-to head, a single-arm bound Fab-to-Fab dimer. (B) Cartoon depiction of a head-to head, double arm-bound Fabʹ2-to-Fabʹ2 dimer.
Supplemental material

Additional material

Download Zip (961.7 KB)

Reprints and Corporate Permissions

Please note: Selecting permissions does not provide access to the full text of the article, please see our help page How do I view content?

To request a reprint or corporate permissions for this article, please click on the relevant link below:

Academic Permissions

Please note: Selecting permissions does not provide access to the full text of the article, please see our help page How do I view content?

Obtain permissions instantly via Rightslink by clicking on the button below:

If you are unable to obtain permissions via Rightslink, please complete and submit this Permissions form. For more information, please visit our Permissions help page.