Figures & data
Figure 1. Overlaid SEC UV traces of an IgG1 mAb and three lots of MAb-A materials shown in expanded scale to enable visualization of small peaks. IgG1 mAb sample has a typical SEC profile, while MAb-A contains an unusual peak, labeled Peak 1.
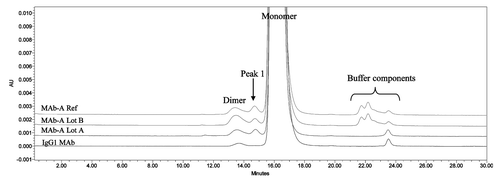
Figure 2. Overlaid SEC UV trace (____) with MALS calculated molar mass (…….) of MAb-A reference material.
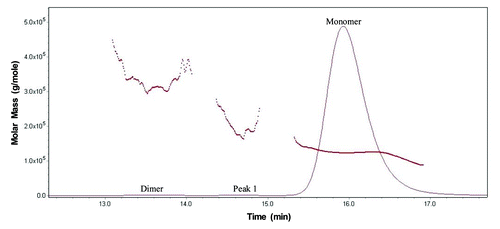
Figure 3. Overlaid chromatograms of MAb-A reference material and a purified SEC Peak 1 fraction shown in full scale and expanded scale in insert.
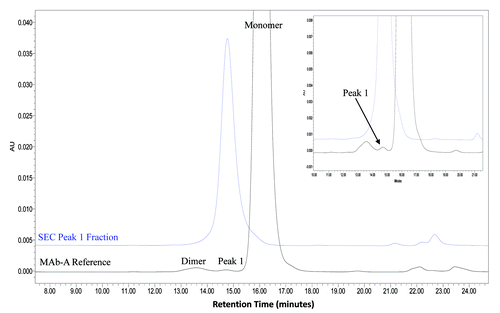
Figure 4. ESI-TOF Deconvoluted masses and theoretical masses for A) MAb-A Lot A SEC Peak 1 fraction and B) MAb-A Lot B SEC Peak 1 fraction.
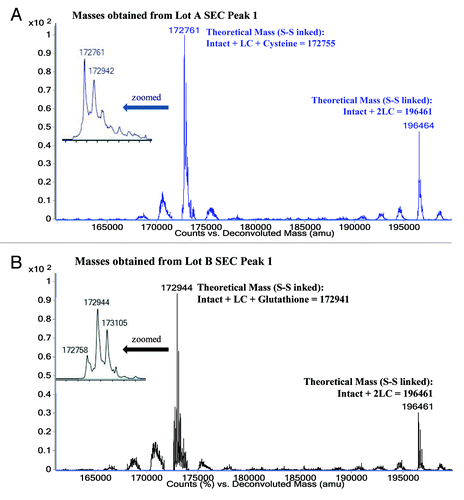
Table 1. Comparison of theoretical masses with ESI-TOF MS observed masses
Figure 5. Electropherograms of non-reduced (A) and reduced (B) MAb-A reference material (Ref) and SEC Peak 1 fraction obtained using Agilent 2100 Bioanalyzer with Protein 250 Kit. NG: non-glycosylated heavy chain.
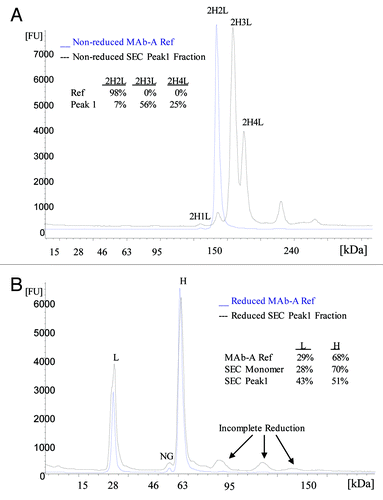
Figure 6. SDS PAGE Sypro Ruby stained gel image of non-reduced and reduced MAb-A samples, SEC monomer and Peak 1 fractions.
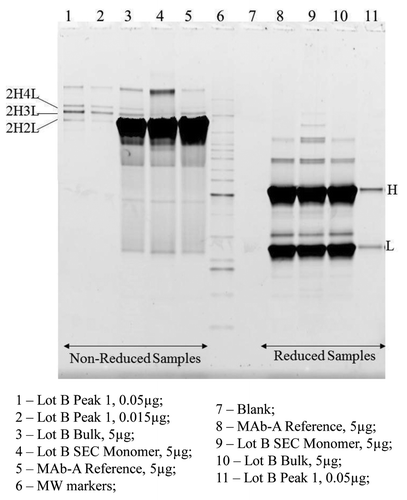
Figure 7. Overlaid total ion chromatograms (TIC) of Lys-C peptide maps of non-reduced MAb-A Lot B, non-reduced Lot B Peak 1, and reduced Lot B Peak 1. H14(Ox.M252)-S-S-H18 is the disulfide linked heavy chain peptide containing oxidized methionine 252 (Ox. M252). H24-S-S-H28(Ox.M428) is the disulfide linked heavy chain peptide containing oxidized methionine 428 (Ox. M428). L6(clipped)-S-S-L12 is the disulfide linked light chain peptide containing a non-specific clip.
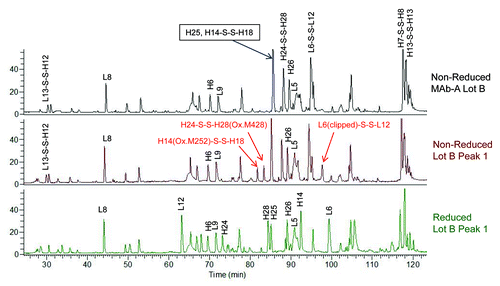
Table 2. Comparison of peptides’ EIC peak areas of Lys-C digested non-reduced MAb-A Lot B and Lot B Peak 1 Fraction
Figure 8. Tandem mass spectrum of the precursor ion of doubly charged disulfide linked L13-S-S-L13 at m/z 811.33. y1-S is the y1 ion without N-terminal serine.
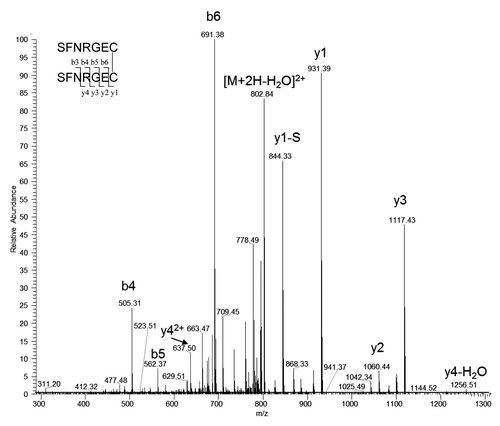
Table 3. Relative EIC peak areas of different forms of light chain C-terminal peptide in non-reduced MAb-A and Peak 1 fraction
Table 4. Potency test results of SEC monomer and peak 1 fractions collected from MAb-A Lot B
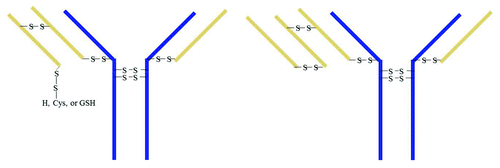
Figure 9. Proposed major structures of SEC Peak 1 components through proposed disulfide linkages (structures due to non-specific binding in LC variable region are not shown). The blue lines represent heavy chains and the orange lines represent light chains.