Figures & data
Figure 1. IGVH and IGJH usage in bone marrow (BM) and spleen (SP) of naïve and spleen lymphocytes in immunized (IM) rabbits. (A) The bars represent the % of heavy chain sequences derived from germline IGHV genes 1S40, 1S45 and 1S69. Germline genes contributing > 5% of the V-gene repertoire in at least one sample are shown. (B) The bars represent the % of heavy chain sequences containing germline IGHJ genes IGHJ2, IGHJ3 and IGHJ4. Germline genes contributing > 2% of the V-gene repertoire in at least one sample are shown. See Table S3 for a complete list of all the genes.
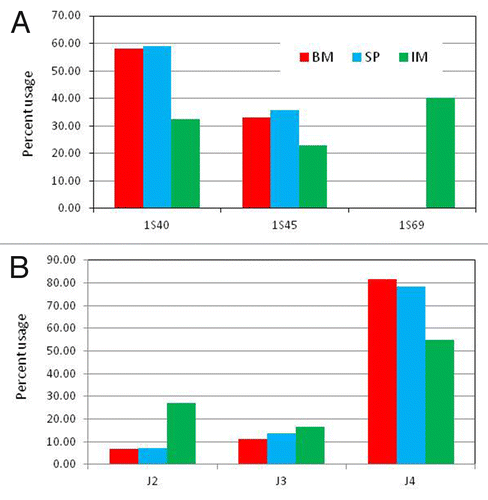
Figure 2. Most prevalent IGVH and IGVK genes. Amino acid sequence alignment of the most prevalent IGVH (A) and IGVK genes (B) observed in the samples analyzed and dendogram (C) showing the diversity and relationship of the IGVK genes. Residues are numbered according to Chothia convention. The Vk amino acid sequences in the dendogram were aligned and dendogram plotted based on average distance calculated from percent identity using Jalview. The numbers close to the braches represent number of mutations
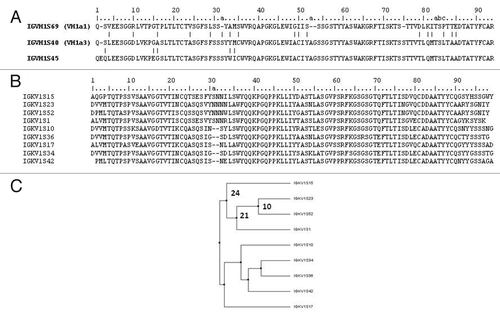
Figure 4. CDR-H3 and L3 length distribution: Frequencies of CDR-H3 (A) and CDR-L3 (B) of different lengths expressed as percentage of the total number analyzed from naïve rabbit bone marrow (BM), spleen (SP and immunized rabbit splenocytes (IM).
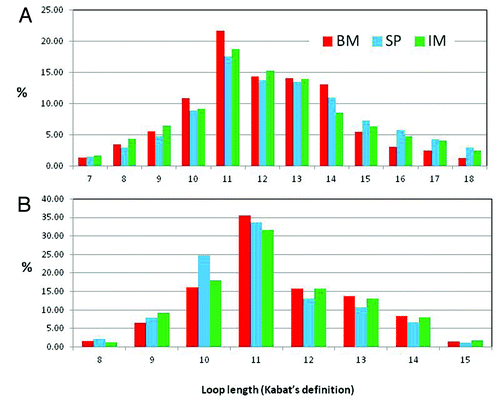
Figure 3. IGVK usage in bone marrow (BM) and spleen (SP) of naïve and spleen lymphocytes in immunized (IM) rabbits. Germline genes contributing > 5% of the V-gene repertoire in at least one sample are shown. Complete listing of all the genes is showed in Table S4 of Supplementary Material.
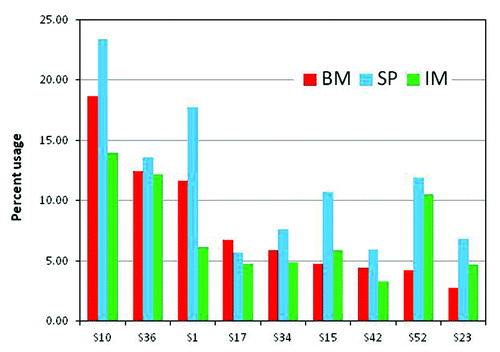
Figure 5. Distribution of total number somatic mutations per read: Total number of mutations per read observed in the three samples, bone marrow (BM), spleen (SP) from naïve rabbit and spleenocytes from immunized rabbit (IM). All reads with germline gene assignment were compared with the respective germline gene sequence and the total number of mutations, except at the first 7 amino acid residues, along the v-gene were counted and the reads were grouped based on the number of mutations. The curves represent the percent of reads with a given number of mutations for VH (A) and VL (B).
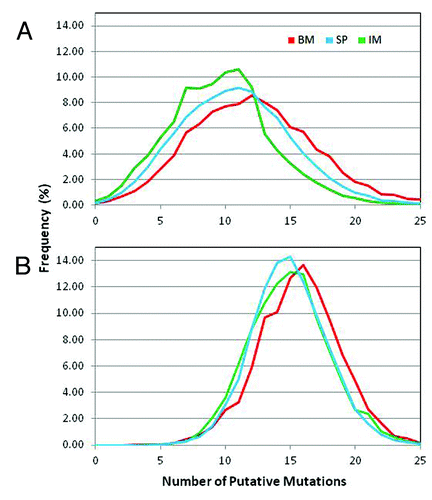
Figure 6. Distribution of somatic mutations along VH: Missense mutations observed in the three samples along the germline genes 1S40, 1S45 and 1S69. The number of missense mutations per position from all the reads derived from the same germline gene is plotted as percent of total number of missense mutations at all the positions for the same set of reads. Missense mutations for the first 7 positions are not calculated since these positions were encoded by the primer used in V-region amplification.
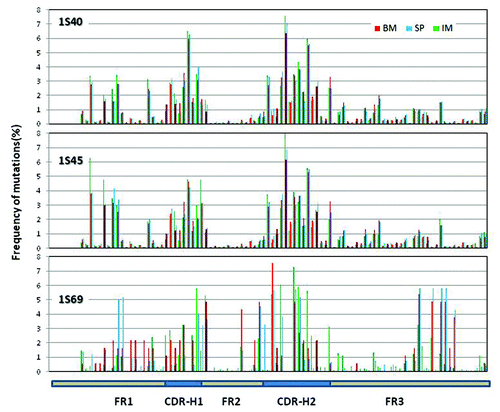
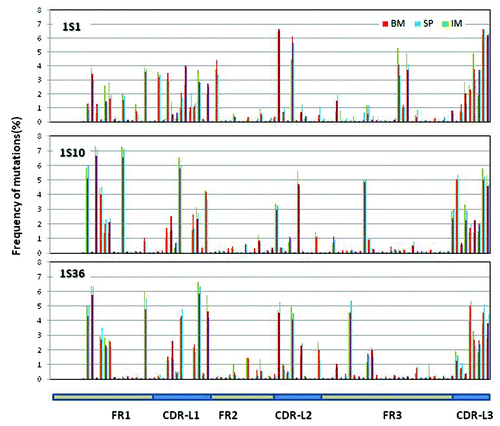
Figure 7. Distribution of somatic mutations along VL: Mutations observed in the three samples along the germline genes 1S1, 1S10 and 1S36. The number of mutations per position from all the reads derived from the same germline gene is plotted as percent of total number of mutations at all the positions for the same set of reads. Mutations for the first 7 positions are not calculated since these positions were encoded by the primer used in V-region amplification.