1,106
Views
6
CrossRef citations to date
0
Altmetric
Report

A novel anti-aldolase C antibody specifically interacts with residues 85–102 of the protein

, , , , , , & show all
Pages 707-716 | Received 05 Dec 2013, Accepted 11 Feb 2014, Published online: 13 Feb 2014

Figures & data

Figure 1. Sequence alignment between the three human aldolase isozymes. Comparison of human aldolase A, B and C amino acid sequences. Sequence 85–102 is boxed. Asterisks (*) represent identical matches in the alignment; colons (:), conserved substitutions; periods (.), semi-conserved substitution. The alignment was performed using the “ClustalW2-Multiple Sequence Alignment” software (www.ebi.ac.uk/Tools/msa/clustalw2).” Red, green, blue and violet correspond to neutral, polar, negative and positive amino acids, respectively.
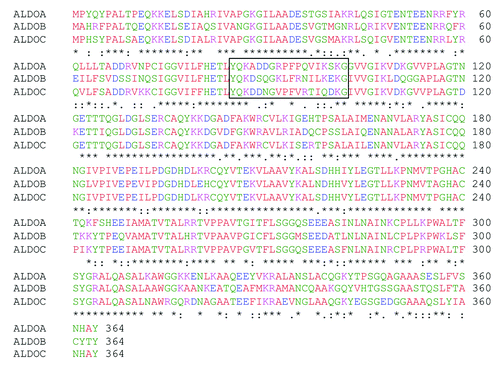
Figure 1. Sequence alignment between the three human aldolase isozymes. Comparison of human aldolase A, B and C amino acid sequences. Sequence 85–102 is boxed. Asterisks (*) represent identical matches in the alignment; colons (:), conserved substitutions; periods (.), semi-conserved substitution. The alignment was performed using the “ClustalW2-Multiple Sequence Alignment” software (www.ebi.ac.uk/Tools/msa/clustalw2).” Red, green, blue and violet correspond to neutral, polar, negative and positive amino acids, respectively.

Figure 2. western blot with the anti-aldolase C 9F mAb. Enhanced chemiluminescence detection of aldolase C protein expression in heart, liver, kidney and brain tissue extracts (mouse). Proteins were separated by 12% SDS-PAGE and probed with the anti-aldolase C 9F mAb. Alpha-tubulin immunoblot was used as loading control.
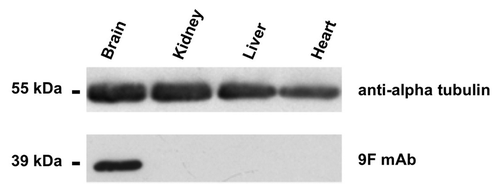
Figure 2. western blot with the anti-aldolase C 9F mAb. Enhanced chemiluminescence detection of aldolase C protein expression in heart, liver, kidney and brain tissue extracts (mouse). Proteins were separated by 12% SDS-PAGE and probed with the anti-aldolase C 9F mAb. Alpha-tubulin immunoblot was used as loading control.

Figure 3. Mapping of the aldolase C region recognized by 9F mAb. (A) and (C) Scheme of the regions of the human aldolase C protein, cloned in the 3xFLAG CMV 7.1 vector. The corresponding clone names are reported on the right. The amino acid limits of each sub-region are indicated by numbers and colors. (B) western blot analysis of total protein lysates from Neuro2a cells alternatively transfected with the 3xFLAG tagged full-length (Full. L.), clone 1, clone 2 or clone 3 fusion products. Proteins were separated by 15% SDS-PAGE and probed with an anti-FLAG antibody (left panel) and with the anti-aldolase C 9F mAb (right panel). (D) western blot analysis of total protein lysates from Neuro2a cells alternatively transfected with the 3xFLAG tagged clone 1A and clone 1B fusion products or mock-transfected. Proteins were separated by 15% SDS-PAGE and probed with an anti-FLAG antibody (upper panel) and with the anti-aldolase C 9F mAb (lower panel). Alpha-tubulin served as loading control.
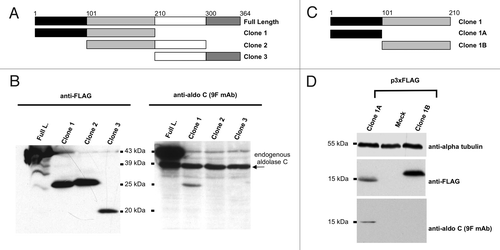
Figure 3. Mapping of the aldolase C region recognized by 9F mAb. (A) and (C) Scheme of the regions of the human aldolase C protein, cloned in the 3xFLAG CMV 7.1 vector. The corresponding clone names are reported on the right. The amino acid limits of each sub-region are indicated by numbers and colors. (B) western blot analysis of total protein lysates from Neuro2a cells alternatively transfected with the 3xFLAG tagged full-length (Full. L.), clone 1, clone 2 or clone 3 fusion products. Proteins were separated by 15% SDS-PAGE and probed with an anti-FLAG antibody (left panel) and with the anti-aldolase C 9F mAb (right panel). (D) western blot analysis of total protein lysates from Neuro2a cells alternatively transfected with the 3xFLAG tagged clone 1A and clone 1B fusion products or mock-transfected. Proteins were separated by 15% SDS-PAGE and probed with an anti-FLAG antibody (upper panel) and with the anti-aldolase C 9F mAb (lower panel). Alpha-tubulin served as loading control.

Table 1. Predicted linear epitope(s) in the aldolase C protein and the corresponding synthesized four peptides

Figure 4. ELISA screening of biotinylated aldolase C peptides. Four different mAb dilution factors were tested in the experiment (1:5,000; 1:10,000; 1:20,000; 1:40,000). X axis, mAb dilution factors; Y axis, absorbance values measured at 450 nm. The marker styles of the four test peptides are indicated in the figure inset together with their amino acid sequence. Underlined letters indicate aldolase C isoenzyme sequence-specific residues as compared with human aldolase A and B. Values are the mean ± SD of duplicate samples and are representative of three independent experiments.
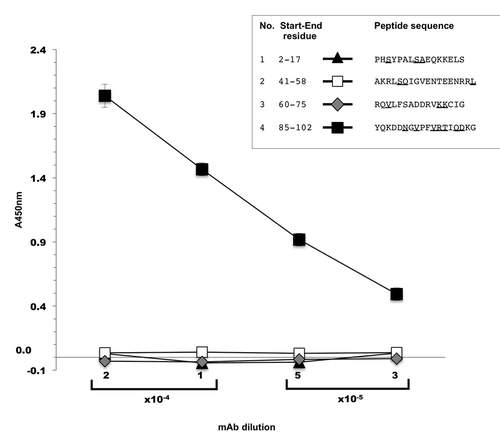
Figure 4. ELISA screening of biotinylated aldolase C peptides. Four different mAb dilution factors were tested in the experiment (1:5,000; 1:10,000; 1:20,000; 1:40,000). X axis, mAb dilution factors; Y axis, absorbance values measured at 450 nm. The marker styles of the four test peptides are indicated in the figure inset together with their amino acid sequence. Underlined letters indicate aldolase C isoenzyme sequence-specific residues as compared with human aldolase A and B. Values are the mean ± SD of duplicate samples and are representative of three independent experiments.

Figure 5. western blot analysis of (A) aldolase C peptides expressed in fusion with a GFP tag at the N-terminus. Total protein extracts obtained from Neuro2a cells alternatively transfected with the four pEGFP-C2 recombinant clones (see Table S2 for details), mock transfected or not transfected were separated by 12% SDS-PAGE and probed using the anti-aldolase C 9F mAb. To have a complete overview of the epitope-mapping, the 3xFLAG-tagged full-length aldolase C and clone 1 fusion proteins were included in the immunoblot panel. Alpha-tubulin served as loading control; anti-FLAG and anti-GFP antibodies were used to verify the transfections. (B) Aldolase C immunoprecipitation with the 9F mAb. Mouse brain lysate (1mg) was immunoprecipitated with the anti-aldolase C 9F mAb (lane 3, IP) after pre-clearing with mouse IgGs (lane 2, IgG). 1/10 of the total immunoprecipitated fractions were analyzed by western blot using the same 9F mAb. Twenty μg of total protein extract were included in the panel as input control (lane 1, Input). (C) Epitope-containing peptide 85–102 mapped on the protein subunit structure. Space filling representation of the aldolase C 3D structure (PDB code 1XFB). Peptide 85–102, which is highly exposed on the protein surface, is shown in yellow.
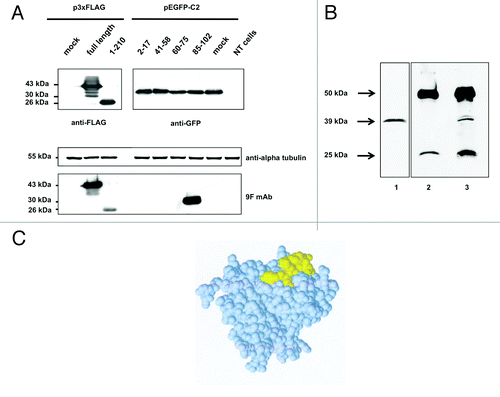
Figure 5. western blot analysis of (A) aldolase C peptides expressed in fusion with a GFP tag at the N-terminus. Total protein extracts obtained from Neuro2a cells alternatively transfected with the four pEGFP-C2 recombinant clones (see Table S2 for details), mock transfected or not transfected were separated by 12% SDS-PAGE and probed using the anti-aldolase C 9F mAb. To have a complete overview of the epitope-mapping, the 3xFLAG-tagged full-length aldolase C and clone 1 fusion proteins were included in the immunoblot panel. Alpha-tubulin served as loading control; anti-FLAG and anti-GFP antibodies were used to verify the transfections. (B) Aldolase C immunoprecipitation with the 9F mAb. Mouse brain lysate (1mg) was immunoprecipitated with the anti-aldolase C 9F mAb (lane 3, IP) after pre-clearing with mouse IgGs (lane 2, IgG). 1/10 of the total immunoprecipitated fractions were analyzed by western blot using the same 9F mAb. Twenty μg of total protein extract were included in the panel as input control (lane 1, Input). (C) Epitope-containing peptide 85–102 mapped on the protein subunit structure. Space filling representation of the aldolase C 3D structure (PDB code 1XFB). Peptide 85–102, which is highly exposed on the protein surface, is shown in yellow.

Figure 6. Aldolase C-NFL RNA co-immunoprecipitation with the 9F mAb. The quantity of NFL RNA immunoprecipitated by 9F mAb (gray bars) from 3xFLAG-tagged aldolase C-transfected cells (full-length) was analyzed by qPCR. The fold enrichment is referred to the anti-GFP immunoprecipitation (white bars) performed as a control experiment. The co-immunoprecipitation from HEK293 cells transfected with the p3xFLAG empty vector (mock) was used as negative control. Results are means ± SD from three independent experiments in duplicate. * P < 0.05 vs. anti-GFP.
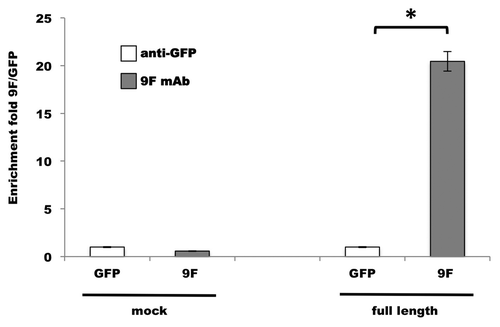
Figure 6. Aldolase C-NFL RNA co-immunoprecipitation with the 9F mAb. The quantity of NFL RNA immunoprecipitated by 9F mAb (gray bars) from 3xFLAG-tagged aldolase C-transfected cells (full-length) was analyzed by qPCR. The fold enrichment is referred to the anti-GFP immunoprecipitation (white bars) performed as a control experiment. The co-immunoprecipitation from HEK293 cells transfected with the p3xFLAG empty vector (mock) was used as negative control. Results are means ± SD from three independent experiments in duplicate. * P < 0.05 vs. anti-GFP.
Supplemental material

Additional material

Download Zip (258.6 KB)