3,970
Views
45
CrossRef citations to date
0
Altmetric
Report

Influence of glycosylation pattern on the molecular properties of monoclonal antibodies

, , , &
Pages 649-658 | Received 14 Feb 2014, Accepted 18 Mar 2014, Published online: 24 Mar 2014

Figures & data

Figure 1. (A) Crystal structure of the Fc region of an IgG1 antibody with glycan attached (PDB: 1H3X). (B) Glycoform patterns of G0, afucosylated, and high mannose forms. Symbols: blue squares, N-acetylglucosamine (GlcNAc); green circles, mannose; red triangles, fucose.
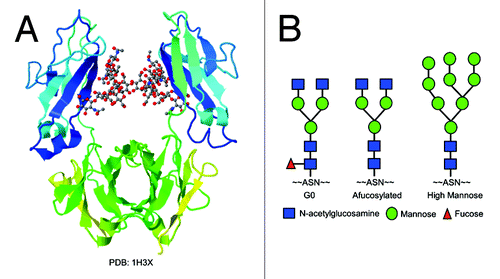
Figure 1. (A) Crystal structure of the Fc region of an IgG1 antibody with glycan attached (PDB: 1H3X). (B) Glycoform patterns of G0, afucosylated, and high mannose forms. Symbols: blue squares, N-acetylglucosamine (GlcNAc); green circles, mannose; red triangles, fucose.

Table 1. Mass of mAb heavy chains

Figure 2. FTIR spectra of glycoforms. Insert: calculated second derivatives of the amide I region. Spectra line colors in both figures: black, control; red, high mannose form; blue, deglycosylated form; magenta, G0 form; cyan, afucosylated form.
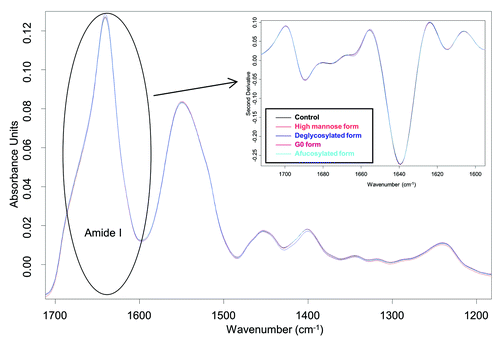
Figure 2. FTIR spectra of glycoforms. Insert: calculated second derivatives of the amide I region. Spectra line colors in both figures: black, control; red, high mannose form; blue, deglycosylated form; magenta, G0 form; cyan, afucosylated form.

Figure 3. Trp emission spectra of glycoforms. Filled markers: black squares, control; red circles, high mannose form; blue triangles, deglycosylated form. Open markers: magenta squares, G0 form; cyan diamonds, afucosylated form.
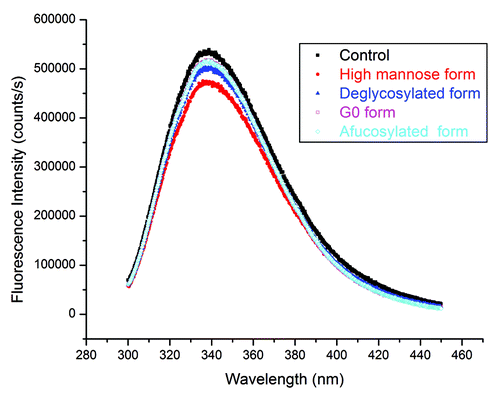
Figure 3. Trp emission spectra of glycoforms. Filled markers: black squares, control; red circles, high mannose form; blue triangles, deglycosylated form. Open markers: magenta squares, G0 form; cyan diamonds, afucosylated form.

Figure 4. Thermal unfolding of glycoforms from DSC measurements. Thermogram line colors: black, control; red, high mannose form; blue, deglycosylated form; magenta, G0 form; cyan, afucosylated form.
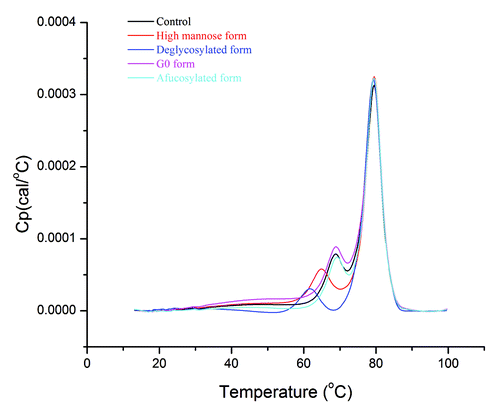
Figure 4. Thermal unfolding of glycoforms from DSC measurements. Thermogram line colors: black, control; red, high mannose form; blue, deglycosylated form; magenta, G0 form; cyan, afucosylated form.

Figure 5. Thermal unfolding of control (filled squares), high mannose (open squares), and deglycosylated (filled triangles) forms from fluorescence measurements. Ratios of fluorescence intensities at 325 and 375 nm are plotted vs. temperature.
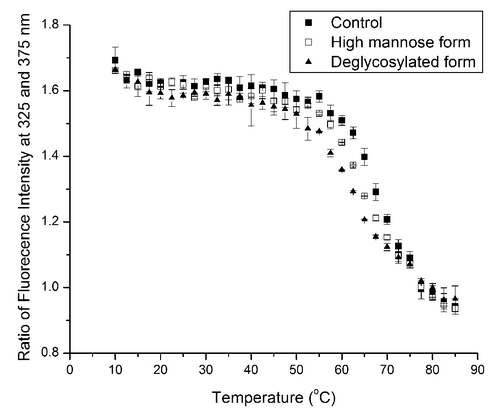
Figure 5. Thermal unfolding of control (filled squares), high mannose (open squares), and deglycosylated (filled triangles) forms from fluorescence measurements. Ratios of fluorescence intensities at 325 and 375 nm are plotted vs. temperature.

Figure 6. Thermal unfolding of control (solid line), high mannose (dashed line), and deglycosylated (dotted line) forms from DSC measurements. Thermograms: (A) at pH 4.0, (B) at pH 5.5, (C) at pH 6.5, (D) at pH 7.0, (E) at pH 7.5.
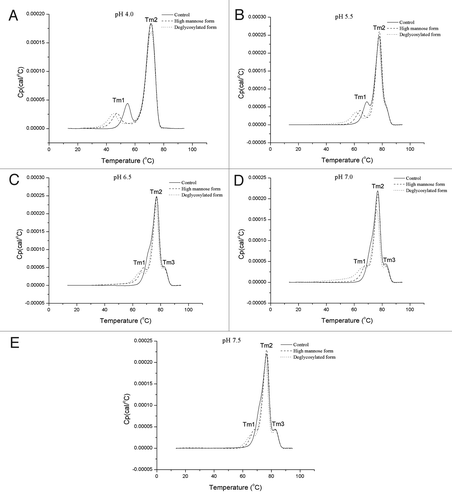
Figure 6. Thermal unfolding of control (solid line), high mannose (dashed line), and deglycosylated (dotted line) forms from DSC measurements. Thermograms: (A) at pH 4.0, (B) at pH 5.5, (C) at pH 6.5, (D) at pH 7.0, (E) at pH 7.5.

Table 2. Thermal transition temperatures (°C) measured by DSC at various pH conditions

Figure 7. Protease digestion of glycoforms monitored by SEC. Digestion profiles: (A) HNE, (B) papain, (C) pepsin. Line colors in all three figures: black, control; red, high mannose form; blue, deglycosylated form; magenta, G0 form; cyan, afucosylated form.
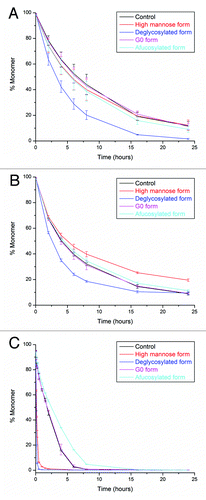
Figure 7. Protease digestion of glycoforms monitored by SEC. Digestion profiles: (A) HNE, (B) papain, (C) pepsin. Line colors in all three figures: black, control; red, high mannose form; blue, deglycosylated form; magenta, G0 form; cyan, afucosylated form.

Figure 8. Stability profiles of glycoforms measured by SEC. Profiles after three-month storage at 30 °C: (A) HMWS and (B) LMWS. Profiles after three-month storage at 40 °C: (C) HMWS and (D) LMWS. Filled markers in all figures: black squares, control; red diamonds, high mannose form; blue triangles, deglycosylated form. Open markers in all figures: magenta squares, G0 form; cyan triangles, afucosylated form.
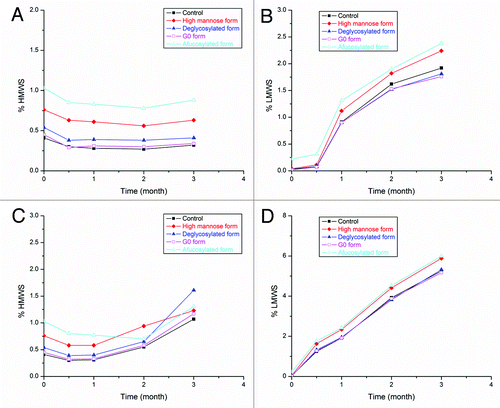
Figure 8. Stability profiles of glycoforms measured by SEC. Profiles after three-month storage at 30 °C: (A) HMWS and (B) LMWS. Profiles after three-month storage at 40 °C: (C) HMWS and (D) LMWS. Filled markers in all figures: black squares, control; red diamonds, high mannose form; blue triangles, deglycosylated form. Open markers in all figures: magenta squares, G0 form; cyan triangles, afucosylated form.

Reprints and Corporate Permissions

Please note: Selecting permissions does not provide access to the full text of the article, please see our help page How do I view content?

To request a reprint or corporate permissions for this article, please click on the relevant link below:

Academic Permissions

Please note: Selecting permissions does not provide access to the full text of the article, please see our help page How do I view content?

Obtain permissions instantly via Rightslink by clicking on the button below:

If you are unable to obtain permissions via Rightslink, please complete and submit this Permissions form. For more information, please visit our Permissions help page.