Figures & data
Figure 1. Schematic depiction of multiplexed assessment of IgG interactions with FcR and lectins. Up to 500 bead sets, each coupled with an FcR or lectin of interest, can be combined into one well containing an antibody sample of interest. Bound antibody is then quantified for each unique receptor bead set using the fluorescent intensity (FI) of a PE-conjugated detection reagent as measured on a Luminex reader.
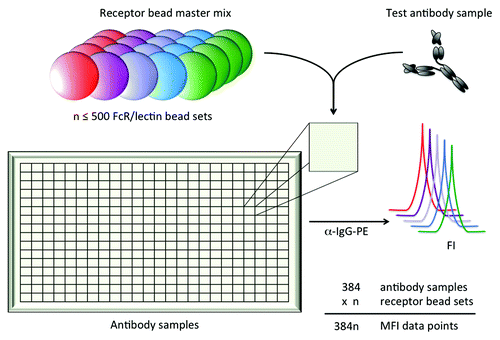
Figure 2. Multiplexed assessment of IgG subclass specificity of FcγR and complement. Extracellular domain allotypes of human FcγR and C1q were simultaneously screened for the ability to bind to fractionated serum IgG1, IgG2, IgG3, and myeloma-derived IgG4, revealing diverse recognition patterns both among IgG subclasses and between FcγR allotypic variants. The median fluorescent intensity (MFI) of antibody bound to each microsphere set was determined across a wide concentration range. Dilutions were performed in duplicate and error bars represent one standard deviation.
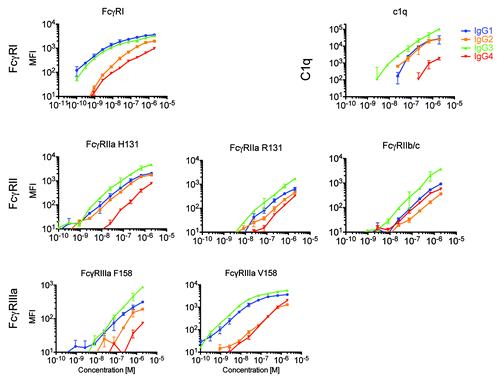
Table 1. Fc domain point mutant panel
Figure 3. Multiplexed prediction of equilibrium binding affinity. Qualitative (A) and quantitative (B,C) relationships between multiplex receptor array signal intensity (MFI) and the equilibrium binding affinities (KD) of the Fc domain point mutant panel. A. Qualitative comparison of multiplex array MFI (left) and affinity (right) as measured by SPR for wildtype (WT) and a pair of trastuzumab backbone Fc domain mutants (SD/IE and SE/HF/ST/IE/GA) with enhanced affinity for FcγRIIa (top) or FcγRIIIa (bottom). B. Quantitative comparison of array MFI vs. published equilibrium binding affinities for C1q for the complement relevant Fc mutants (run in duplicate) on the VRC-01 backbone. C. Quantitative comparison of the equilibrium binding affinity derived from the microsphere array (KD ≈EC50) vs. published values across multiple FcγR for the Fc mutant panel (run in duplicate) on the VRC-01 backbone.
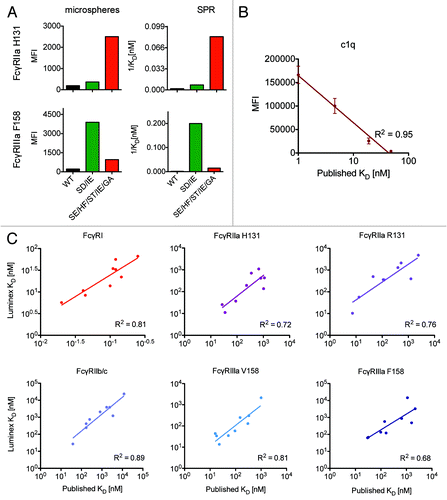
Figure 4. Probing glycan dependence of polyclonal antibody samples. A,B: FcγR (A) or lectin (B) conjugated beads were incubated with 267 nM of native IgG pooled from HIV positive donors (HIVIG) or HIVIG treated with PNGaseF to remove N-linked glycans. For comparability of fluorescent signals across multiple bead sets, HIVIG binding to each bead set was assigned an MFI of 1 and binding of de-glycosylated HIVIG to each bead type was plotted on this relative scale. An anti-human IgG capture bead (IgG) was used a positive control to ensure de-glycosylation had not compromised antibody structure. The mean of 3 replicates is plotted and error bars denote the %CV. C,D: In a separate experiment, native and de-glycosylated HIVIG were mixed in varying proportions before being incubated with FcγR (C) or lectin (D) beads in order to determine the dose-dependence of glycosylation status. Relative MFI scale established with respect to native HIVIG for each bead set, as in A,B.
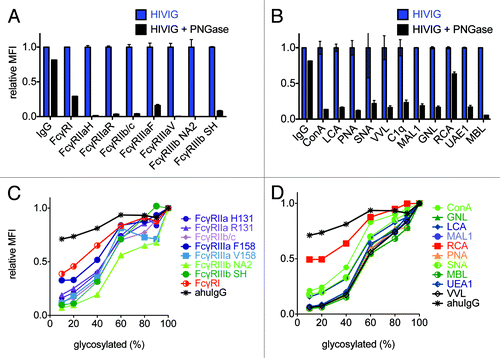
Figure 5. Probing glycan dependence of glycoengineered monoclonal antibodies. A-D: VRC-01 cultured with and without kifunensine was incubated with a panel of lectin-coupled microspheres to evaluate the assay’s ability to probe fine antibody glycoform composition. The median fluorescent intensity (MFI) of antibody bound to lectin-coupled microspheres specific for mannose (ConA, A), fucose (AAL, B), sialic acid (SNA, C), or galactose (RCA, D) was determined across a wide concentration range. Dilutions were performed in duplicate and error bars represent one standard deviation.
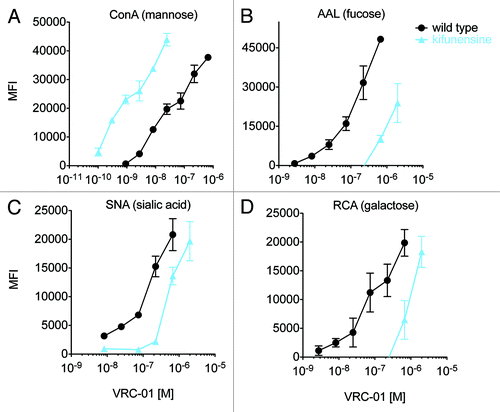
Figure 6. Probing glycan dependence of FcR. The relative FcγR and complement binding of wild type and glycoengineered (kifunensine-treated) VRC-01 having nonfucosylated and oligomannose glycans. Samples were tested at a single concentration in triplicate, and error bars represent one standard deviation. The mean of binding of wildtype VRC-01 across replicates was assigned a relative MFI of 1 for each receptor bead set.
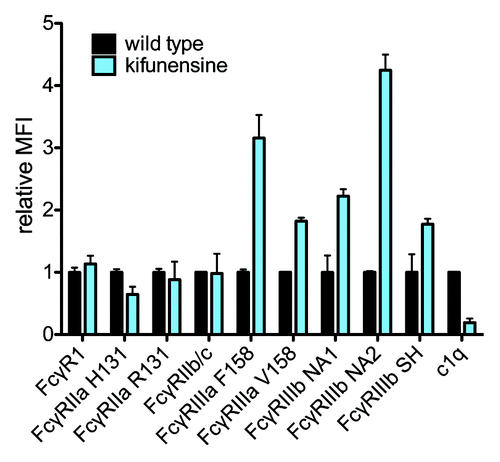
Figure 7. Glycan preference and buffer dependence of non-classical FcR. A. The relative ability of VRC-01 produced by untreated (wildtype) or kifunensine-treated cells and a non-glycosylated mutant (N297Q), to bind to DC-SIGN, Dectin-2 FcRL5, MBL2 and MMR was assessed. The MFI observed for each of 3 replicates relative to the mean MFI observed for wildtype VRC-01 is presented. B. The calcium-dependence and ability of mannan (+ Man) to compete for binding of VRC-01 produced with kifunensine treated cells against a panel of FcR is presented.
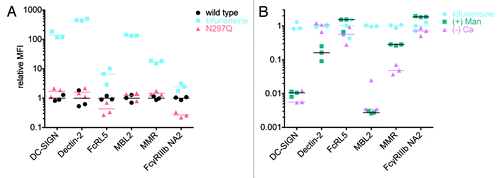
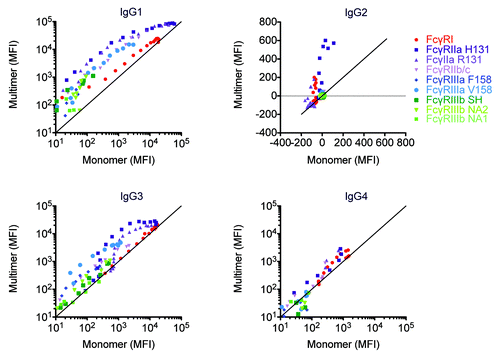
Figure 8. Avidity differentially modulates FcγR:antibody ligation among IgG subclasses and FcγR. Myeloma derived IgG1, IgG2, and IgG4 and pooled serum derived IgG3 were separated into monomeric and multimeric fractions by SEC. Across a range of matched concentrations, the ability of IgG monomer and multimer samples to bind FcγR was assessed.