Figures & data
Figure 1. 91R mAb is specific for human chemokine receptor CCR9. (A) HEK293 cells stably transfected with hCCR9, mCCR9, hCCR4, hCCR5, hCCR6, hCCR8 (open histograms) or the empty pCIneo vector (filled histograms) were stained with 91R mAb and analyzed by flow cytometry. (B) Human leukemia MOLT-4 and Jurkat cells were stained with anti-human CCR9 mAb 91R and 112509 (open histograms) or isotype-matched control mAbs (filled histograms) and analyzed by flow cytometry. (C) Representative flow cytometry analysis of MOLT-4 staining with different doses (0.1–10 μg/ml) of 91R (filled histograms), 112509 (open histograms), or isotype-matched mAb (gray lines) (n = 5). (D) Flow cytometry analysis of human thymocytes using anti-CD4, -CD8 and –CCR9 91R antibodies. Percentages of positive cells in gates of the CD4/CD8 plot are indicated; hCCR9 expression is shown for each subpopulation. (E) Flow cytometry shows a FS/SS dotplot for total human peripheral blood cells and 91R/anti-CD3 staining in the lymphocyte gate. (F) Representative western blot of membrane-enriched fractions of hCCR9- or pCIneo-transfected HEK293 cells, MOLT-4, and Jurkat cells incubated with 91R; the same membrane was probed with anti-CD71 Ab as loading control (n = 3).
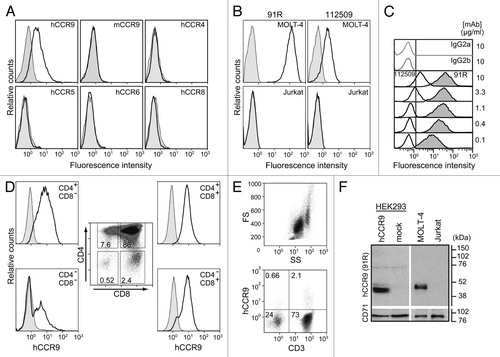
Figure 2. 91R mAb recognizes the human CCR9 N-terminal domain. (A) Diagram of human and mouse CCR9 and the chimeric CCR9 bearing the human CCR9 sequence with the N-terminal domain (Nt) replaced by the murine sequence (mNt/hCCR9); flow cytometry analyses with 91R mAb (anti-hCCR9; open histograms) and isotype-matched control mAb (filled histograms), rabbit polyclonal K629 (anti-mCCR9; open histograms) and rabbit control Ab (filled histograms). (B) Membrane-enriched lysates from pCIneo-, hCCR9-HEK and MOLT-4 cells were used for western blot with 91R; anti-CD71 Ab was used as loading control. Where indicated, cell lysates were PNGase-treated to remove N-glycosylated residues. A representative experiment is shown (n = 2).
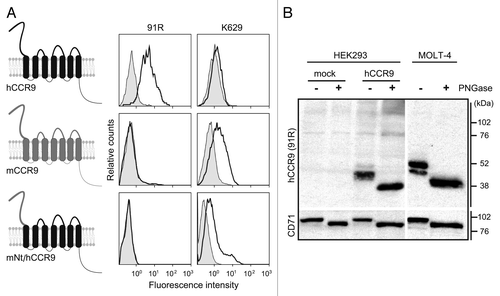
Figure 3. Human CCL25 partially competes with 91R mAb for binding to MOLT-4 cells. Representative flow cytometry analysis of human MOLT-4 cells, preincubated alone or with 10 μg/ml hCCL25 or hCXCL12 (40 min, 4 °C), stained with 91R or isotype-matched mAb (n = 3).
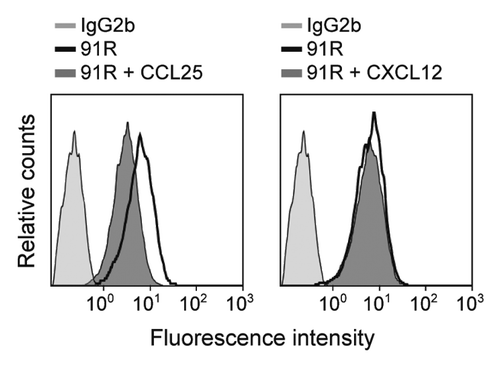
Figure 4. Leukemia xenograft growth is reduced in mice treated with 91R mAb. For xenograft analyses, MOLT-4 cells were inoculated s.c. in Rag2−/− mice on day 0 (d0). Experimental groups received four i.p. doses of 91R or irrelevant IgG2b mAb (first and second, 4 mg/kg; third and fourth, 2 mg/kg). Tumor growth was measured with a caliper every three days. After mice were sacrificed, tumors were removed and weighed. (A) Antibody administration schedule on days 1, 7, 14 and 21 for mice bearing tumor cells injected in each flank. (B) Tumor growth kinetics. Tumor volume was measured at times indicated and calculated as V = [axial diameter length, mm] x [(rotational diameter, mm)2/2] (6 mice/group). (C) Tumor weight (%) relative to IgG2b treatment on d56. Mean ± SEM (n = 6 mice/group). (D) Images of tumors from IgG2b- and 91R-treated mice at the time of sacrifice (day 56). Bar = 1 cm. (E) Antibody administration schedule on days 7, 14, 21, and 28 in mice injected only in one flank. (F) Tumor volume was calculated as in B (10 mice/group). (G) Percentage of tumor weight relative to IgG2b treatment on d69. Results show mean ± SEM (n = 10 mice/group). (H) Images of tumors from IgG2b- and 91R-treated mice at the time of sacrifice (day 69). Bar = 1 cm. *** P < 0.001, ** P < 0.01, * P < 0.05.
![Figure 4. Leukemia xenograft growth is reduced in mice treated with 91R mAb. For xenograft analyses, MOLT-4 cells were inoculated s.c. in Rag2−/− mice on day 0 (d0). Experimental groups received four i.p. doses of 91R or irrelevant IgG2b mAb (first and second, 4 mg/kg; third and fourth, 2 mg/kg). Tumor growth was measured with a caliper every three days. After mice were sacrificed, tumors were removed and weighed. (A) Antibody administration schedule on days 1, 7, 14 and 21 for mice bearing tumor cells injected in each flank. (B) Tumor growth kinetics. Tumor volume was measured at times indicated and calculated as V = [axial diameter length, mm] x [(rotational diameter, mm)2/2] (6 mice/group). (C) Tumor weight (%) relative to IgG2b treatment on d56. Mean ± SEM (n = 6 mice/group). (D) Images of tumors from IgG2b- and 91R-treated mice at the time of sacrifice (day 56). Bar = 1 cm. (E) Antibody administration schedule on days 7, 14, 21, and 28 in mice injected only in one flank. (F) Tumor volume was calculated as in B (10 mice/group). (G) Percentage of tumor weight relative to IgG2b treatment on d69. Results show mean ± SEM (n = 10 mice/group). (H) Images of tumors from IgG2b- and 91R-treated mice at the time of sacrifice (day 69). Bar = 1 cm. *** P < 0.001, ** P < 0.01, * P < 0.05.](/cms/asset/b522c180-7fed-45a0-9ab5-bd8dc6fe0369/kmab_a_10929063_f0004.gif)
Figure 5. Short-term kinetics of 91R-induced reduction of leukemia xenograft growth. (A) Treatment schedule using luminescent MOLT-4 cells (MOLT-4-luc) inoculated s.c. into each flank of Rag2−/− mice on d0. Experimental groups received i.p. inoculations of 91R or control IgG2b mAb on d1 (4 mg/kg) and d6 (2 mg/kg). Luminescence imaging was analyzed from days 1 to 28; mice were sacrificed on d62 and tumors removed. (B) Images of a representative mouse from each group at indicated times post-cell inoculation. (C) Tumor growth kinetics after tumor implant. Relative bioluminescence units are shown as mean ± SEM (D) Percentage of tumor weight relative to IgG2b treatment at d62. Results show mean ± SEM (E) Tumor weights per mouse; data show mean ± SEM. C-E, n = 7 mice/group. *** P < 0.001, ** P < 0.01, * P < 0.05.
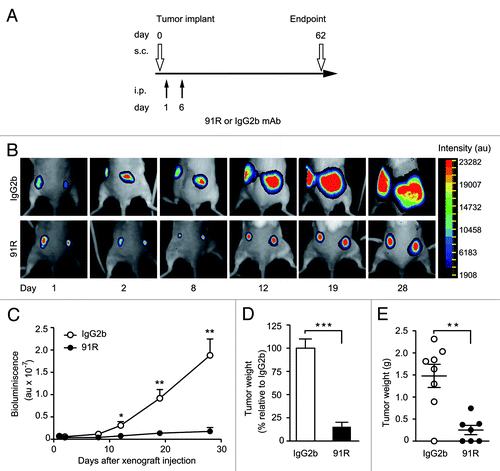
Figure 6. 91R promotes apoptosis and necrosis and reduces cell proliferation and angiogenesis in tumor xenografts. (A-D) Histological analysis of xenografted MOLT-4 tumors (n = 5 mice/group). (A) Hematoxylin/eosin-stained sections from xenografted MOLT-4 tumors treated with 91R or control IgG2b mAb; bar = 2 mm. Right, images at higher magnification; bar = 25 μm. (B) Graph shows percentage of tumors classified by necrotic stage (< 1%, 1–30% and > 30%). Chi-square test, ***P < 0.0001. (C) Apoptosis level in tumors was analyzed by TUNEL assays. Proliferation levels were determined by PCNA immunostaining. Blood vessels were detected by CD31 staining. Tissue sections were DAPI-counterstained. Bar = 50 μm. (D) Quantitative analyses of TUNEL- and PCNA-positive nuclei and vessels per optical field. Mann-Whitney test, *** P < 0. 001, ** P < 0. 01, * P < 0.05.
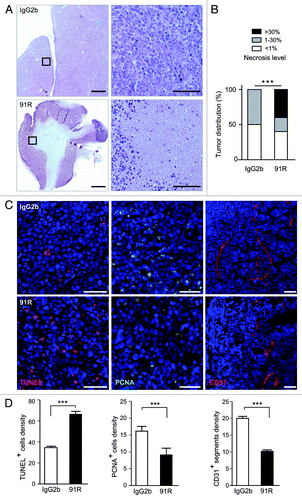
Figure 7. 91R mAb promotes in vitro complement-dependent cytotoxicity in human leukemic MOLT-4 cells. MOLT-4 cells were opsonized with 91R or isotype-matched mAb (40 μg/ml, 30 min, 37 °C), washed, and incubated (1 h) with 25% active (37 °C) or inactive (56 °C) baby rabbit complement (BRC); cell viability was evaluated in a flow cytometer by 7-AAD staining. (A) Specific complement lysis in the absence of antibody or with 91R, 112509, or isotype-matched mAb (IgG2a or IgG2b). Each condition was analyzed in triplicate. Data show mean ± SEM for four independent experiments. (B) Dose-response curve for specific complement lysis using 91R and a control IgG2b mAb at indicated concentrations. Data show mean ± SEM for one representative experiment of four. (C) Effect of time exposure to BRC. Data show mean ± SEM for triplicates from one representative experiment of two. (D) Specific complement lysis in a dose response curve for BRC. Data show percent mean ± SEM for triplicates from one representative experiment of two. *** P < 0.001, ** P < 0.01, * P < 0.05.
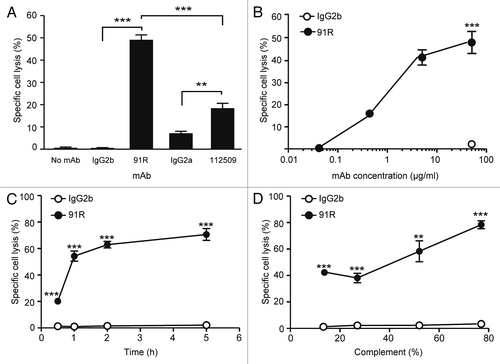
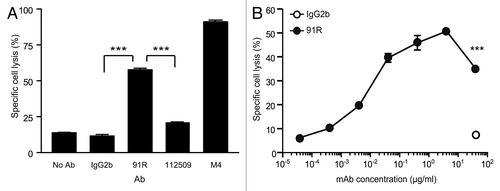
Figure 8. NK cell-mediated cytotoxicity promoted by 91R mAb in human MOLT-4 leukemia cells. (A) Specific NK-dependent cytotoxicity mediated by 91R, 112509, negative control mAb or positive control M4 serum. NK cells were isolated from BALB/c spleens and cultured for 6–7 d in medium containing IL-2. CFSE-labeled MOLT-4 target cells were preincubated with 91R, 112509 or control mAb (20 μg/ml), or M4 pooled sera (1:1000) (30 min, 37 °C). NK cells and labeled target cells were then co-cultured at a 20:1 ratio (4 h, 37 °C). Specific lysis was determined by staining dead cells with 7-AAD and analyzing the number of 7-AAD+ green cells by flow cytometry. Each condition was analyzed in triplicate. Data show mean ± SEM (n = 5 independent experiments). (B) Dose-response curve for specific complement lysis using 91R and a control IgG2b mAb at indicated concentrations. Data show mean ± SEM for duplicates from one representative experiment of four. *** P < 0.001, ** P < 0.01, * P < 0.05.
