1,425
Views
9
CrossRef citations to date
0
Altmetric
Report

Small scale affinity purification and high sensitivity reversed phase nanoLC-MS N-glycan characterization of mAbs and fusion proteins

, , , &
Pages 894-903 | Received 31 Mar 2014, Accepted 16 May 2014, Published online: 21 May 2014

Figures & data

Figure 1. Schematic work-flow. Up to 2x 96 samples can be handled simultaneously. Immobilized Protein A or Protein G is used to capture mAbs, Fc-containing fusion proteins or other IgGs with high specificity. Immobilized target is then highly efficiently deglycosylated with the use of PNGaseF. Released N-Glyans are labeled with 2-AA via reductive amination after ultrafiltration to remove remaining proteins. Labeled and purified 2-AA glycans are identified and quantified by RP nanoLC-MS by use of an ion-trap mass spectrometer.
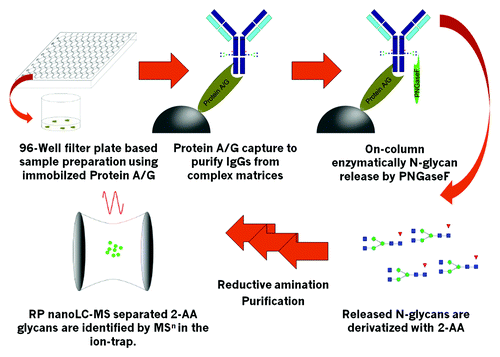
Figure 1. Schematic work-flow. Up to 2x 96 samples can be handled simultaneously. Immobilized Protein A or Protein G is used to capture mAbs, Fc-containing fusion proteins or other IgGs with high specificity. Immobilized target is then highly efficiently deglycosylated with the use of PNGaseF. Released N-Glyans are labeled with 2-AA via reductive amination after ultrafiltration to remove remaining proteins. Labeled and purified 2-AA glycans are identified and quantified by RP nanoLC-MS by use of an ion-trap mass spectrometer.

Figure 2. NanoLC-MS glycan map of a monoclonal antibody. 1.6 pmol of 2-AA labeled N-glycans corresponding to ~120 ng antibody were used for analysis. EICs of the 2-AA labeled N-glycans are depicted. Complete glycan map (A) and magnified view (B) are shown. Peaks are numbered in elution order. Identified glycans are listed in , glycan structures are depicted in Figure S6.
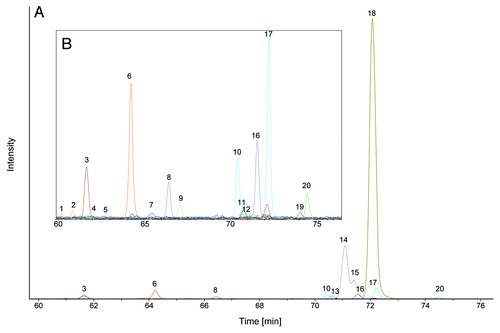
Figure 2. NanoLC-MS glycan map of a monoclonal antibody. 1.6 pmol of 2-AA labeled N-glycans corresponding to ~120 ng antibody were used for analysis. EICs of the 2-AA labeled N-glycans are depicted. Complete glycan map (A) and magnified view (B) are shown. Peaks are numbered in elution order. Identified glycans are listed in Table 1, glycan structures are depicted in Figure S6.

Table 1. 2-AA glycans observed in the glycan map of a monoclonal antibody

Figure 3. Glycan map of four Fc containing therapeutic proteins derived from clone selection phase determined by nanoLC-MS after small scale sample preparation. Clones 1–4 are shown exemplarily. (A) Percentages of the different glycoforms are shown. Error bars indicate variability of the method. Glycosylation pattern of the four clones is similar. (B) Magnified view shows the minor abundant N-glycans
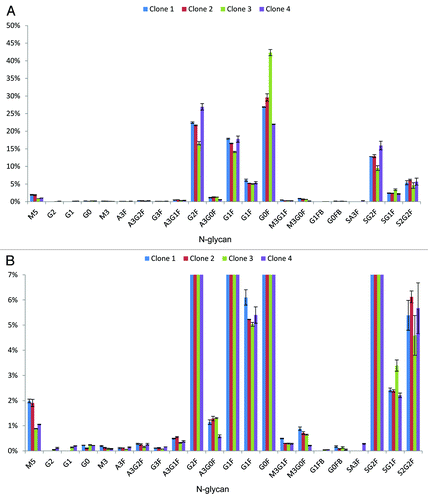
Figure 3. Glycan map of four Fc containing therapeutic proteins derived from clone selection phase determined by nanoLC-MS after small scale sample preparation. Clones 1–4 are shown exemplarily. (A) Percentages of the different glycoforms are shown. Error bars indicate variability of the method. Glycosylation pattern of the four clones is similar. (B) Magnified view shows the minor abundant N-glycans

Figure 4. Correlation plots comparing glycan maps of four clones after downstream processing to glycan maps obtained with the newly developed 96-well based nanoLC-MS analysis. Most abundant N-glycans are labeled and linear correlation coefficients are depicted. Insets show the minor abundant N-glycans.
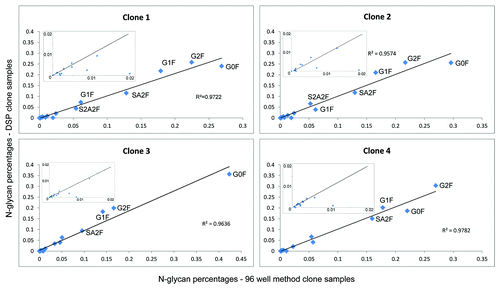
Figure 4. Correlation plots comparing glycan maps of four clones after downstream processing to glycan maps obtained with the newly developed 96-well based nanoLC-MS analysis. Most abundant N-glycans are labeled and linear correlation coefficients are depicted. Insets show the minor abundant N-glycans.

Figure 5. Glycan map of human serum IgGs. (A) EICs of the various 2-AA labeled N-glycans are shown. Peak numbering is according to elution order. lists the identified glycans and their relative amount and Figure S6 shows the glycan structures.
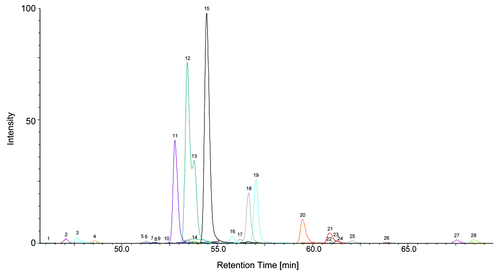
Figure 5. Glycan map of human serum IgGs. (A) EICs of the various 2-AA labeled N-glycans are shown. Peak numbering is according to elution order. Table 2 lists the identified glycans and their relative amount and Figure S6 shows the glycan structures.

Table 2. 2-AA labeled N-glycans identified from human serum IgGs

Supplemental material

Additional material

Download Zip (1.3 MB)