818
Views
3
CrossRef citations to date
0
Altmetric
Brief Report

Bacterial expression and characterization of a novel human anti-IgE scFv fragment

, , , , , , & show all
Pages 495-499 | Received 22 Jul 2011, Accepted 09 Jun 2011, Published online: 01 Sep 2011

Figures & data

Figure 1 (A) DNA and amino acid sequence of the human anti-IgE scFv. IGHV1-2*02 and IGKV1D-12*02 germline sequences are also shown for comparison. Complementarity determining regions (CDRs) are indicated. Residues different to the germline sequences are shown while the identical residues are marked by -. (B) A diagram showing the essential elements of the construct for E. coli expression. T7, T7 promoter; Pel B, the leader sequence; scFv, single-chain antibody fragment. The (His)6-tag and transcription and translation termination region are also indicated.
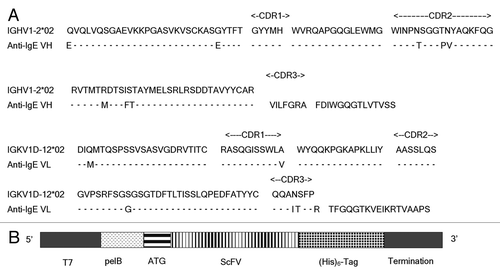
Figure 1 (A) DNA and amino acid sequence of the human anti-IgE scFv. IGHV1-2*02 and IGKV1D-12*02 germline sequences are also shown for comparison. Complementarity determining regions (CDRs) are indicated. Residues different to the germline sequences are shown while the identical residues are marked by -. (B) A diagram showing the essential elements of the construct for E. coli expression. T7, T7 promoter; Pel B, the leader sequence; scFv, single-chain antibody fragment. The (His)6-tag and transcription and translation termination region are also indicated.

Figure 2 scFv expression in E. coli. (A) Coomassie blue stain. Lane 1, un-induced total cell (prior to IPTG induction); lane 2, induced total cell (at time of the harvest); Lane 3, periplasmic extract; Lane 4, flow through mixture from Ni-sepharose column; Lane 5, washes; Lane 6, elution from Ni-sepharose column. (B) Western blotting of (A) using anti-His antibody as the probe. The samples are in the same order as in (A). The scFv is indicated by arrows. M, the standard markers (KDa).
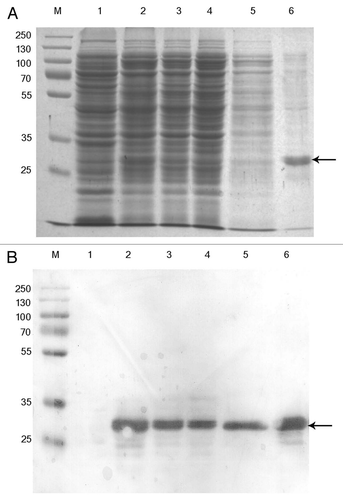
Figure 2 scFv expression in E. coli. (A) Coomassie blue stain. Lane 1, un-induced total cell (prior to IPTG induction); lane 2, induced total cell (at time of the harvest); Lane 3, periplasmic extract; Lane 4, flow through mixture from Ni-sepharose column; Lane 5, washes; Lane 6, elution from Ni-sepharose column. (B) Western blotting of (A) using anti-His antibody as the probe. The samples are in the same order as in (A). The scFv is indicated by arrows. M, the standard markers (KDa).
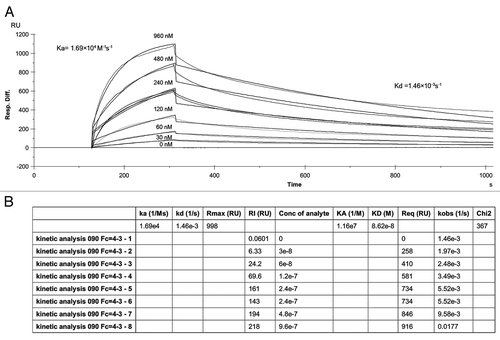
Figure 3 ELISA analysis. (A) Binding of scFv on IgE coated wells. The amount of scFv used in the dilution was shown as uM. (B) Competitive inhibition assay.

Figure 3 ELISA analysis. (A) Binding of scFv on IgE coated wells. The amount of scFv used in the dilution was shown as uM. (B) Competitive inhibition assay.

Figure 4 Biacore analysis. The scFv was injected at various concentrations as indicated by different lines.

Figure 4 Biacore analysis. The scFv was injected at various concentrations as indicated by different lines.

Reprints and Corporate Permissions

Please note: Selecting permissions does not provide access to the full text of the article, please see our help page How do I view content?

To request a reprint or corporate permissions for this article, please click on the relevant link below:

Academic Permissions

Please note: Selecting permissions does not provide access to the full text of the article, please see our help page How do I view content?

Obtain permissions instantly via Rightslink by clicking on the button below:

If you are unable to obtain permissions via Rightslink, please complete and submit this Permissions form. For more information, please visit our Permissions help page.