1,080
Views
23
CrossRef citations to date
0
Altmetric
Report

A recombinant triplebody with specificity for CD19 and HLA-DR mediates 
preferential binding to antigen double-positive cells by dual-targeting

, , , , , , , , , & show all
Pages 45-56 | Received 26 Sep 2011, Accepted 23 Oct 2011, Published online: 01 Jan 2012

Figures & data

Figure 1 Design, purification and antigen binding of sctb HLA-ds16-hu19. (A) Block-structure of expression construct. I, secretion leader sequence from the murine Igkappa L chain; VL, VH, cDNA sequences coding for the V regions of Ig L-or H-chains; L, cDNA coding for a 20 amino acid flexible linker (Gly4Ser)4; S, m, H, cDNA coding for a strep-, c-myc- or a hexahistidine tag; S-S, stabilizing disulfide bond. (B) Integrity and purity of the sctb HLA-ds16-hu19 after affinity chromatography with Strep-tactin agarose beads as evaluated by reducing SDS-PAGE and staining with Coomassie blue. (C) Protein gel blot analysis using anti-his or (D) anti-strep antibodies for detection.
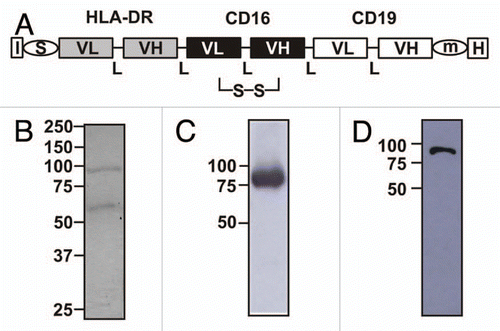
Figure 1 Design, purification and antigen binding of sctb HLA-ds16-hu19. (A) Block-structure of expression construct. I, secretion leader sequence from the murine Igkappa L chain; VL, VH, cDNA sequences coding for the V regions of Ig L-or H-chains; L, cDNA coding for a 20 amino acid flexible linker (Gly4Ser)4; S, m, H, cDNA coding for a strep-, c-myc- or a hexahistidine tag; S-S, stabilizing disulfide bond. (B) Integrity and purity of the sctb HLA-ds16-hu19 after affinity chromatography with Strep-tactin agarose beads as evaluated by reducing SDS-PAGE and staining with Coomassie blue. (C) Protein gel blot analysis using anti-his or (D) anti-strep antibodies for detection.

Figure 2 Specific antigen binding of sctb HLA-ds16-hu19. (A) FACS analysis of specific binding of sctb to CD19-transfected HEK 293 cells (i), untransfected HEK 293 cells (ii). (B) Specific binding to CD16-transfected CHO cells (i), an incubation with untransfected CHO cells showed no binding (ii). (C) Incubation of sctb with HLA-DR-transfected L66 cells resulted in binding (i), whereas incubation with untransfected L66 cells produced no binding (ii). Dark gray peak, signal from sctb; light gray peak, signal from control sctb.
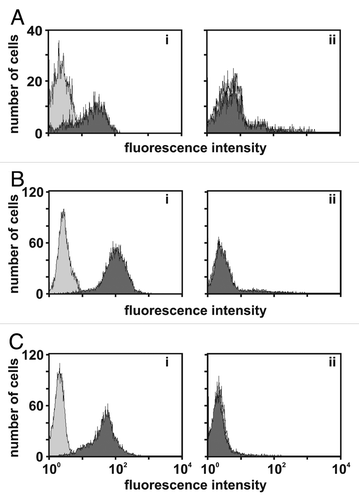
Figure 2 Specific antigen binding of sctb HLA-ds16-hu19. (A) FACS analysis of specific binding of sctb to CD19-transfected HEK 293 cells (i), untransfected HEK 293 cells (ii). (B) Specific binding to CD16-transfected CHO cells (i), an incubation with untransfected CHO cells showed no binding (ii). (C) Incubation of sctb with HLA-DR-transfected L66 cells resulted in binding (i), whereas incubation with untransfected L66 cells produced no binding (ii). Dark gray peak, signal from sctb; light gray peak, signal from control sctb.

Figure 3 HLA-ds16-hu19 selectively binds double-positive cells by dual-targeting. Stained SEM cells (CD19- and HLA-DR-positive) were mixed with unlabeled HUT-78 cells (HLA-DR positive) in an equal amount (A and B), and with a ratio of 1:10 (C) or 1:20 (D). Mixtures were incubated with PBA (A) or the sctb HLA-ds16-hu19 (B–D). Bound molecules were detected by flow cytometry (10,000 events collected) with an anti-His-antibody and a PE-conjugated Fab-fragment. SEM cells were detected in the upper left quadrant, the unstained HUT-78 cells in the lower left quadrant. Cells bound by the sctb shifted to the right quadrants. Numbers represent the percentage of the cells in the respective quadrants.
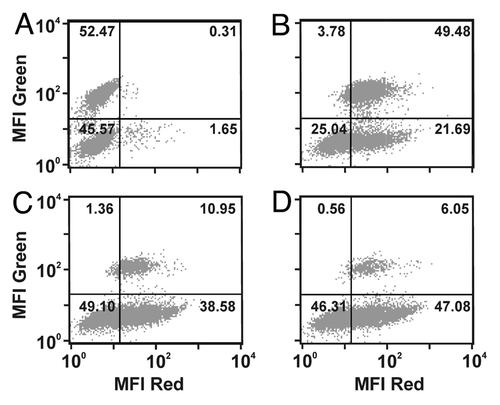
Figure 3 HLA-ds16-hu19 selectively binds double-positive cells by dual-targeting. Stained SEM cells (CD19- and HLA-DR-positive) were mixed with unlabeled HUT-78 cells (HLA-DR positive) in an equal amount (A and B), and with a ratio of 1:10 (C) or 1:20 (D). Mixtures were incubated with PBA (A) or the sctb HLA-ds16-hu19 (B–D). Bound molecules were detected by flow cytometry (10,000 events collected) with an anti-His-antibody and a PE-conjugated Fab-fragment. SEM cells were detected in the upper left quadrant, the unstained HUT-78 cells in the lower left quadrant. Cells bound by the sctb shifted to the right quadrants. Numbers represent the percentage of the cells in the respective quadrants.

Figure 4 The dual-targeting sctb HLA-ds16-hu19 mediates potent lysis of CD19- and HLA-DR-positive Raji cells with isolated MNCs from healthy donors as effector cells. (A) At the concentration of 1 nM the sctb induced significant ADCC over a broad range of E:T ratios and the extent of specific lysis increased with increasing E:T ratios (black bars: sctb; gray bars: control sctb, white bars: no fusion protein). Data are presented as mean percentage lysis ± standard error of the mean (SEM) obtained with MNCs from four different healthy donors. *Statistically significant values, p ≤ 0.05. (B) Whole blood was fractionated into PMN and MNC to identify the relevant effector population for the sctb. Bars indicate sctb at a concentration of 1 nM. *Statistically significant (p ≤ 0.05) lysis. Data are acquired for four different donors. (C) Ag-specific induction of ADCC in the double-positive cell-line Raji by sctb HLA-ds16-hu19. The sctb induced potent lysis of Raji cells at a concentration of 1 nM. Simultaneous addition of a 500-fold molar excess of CD19- and HLA-DR-specific scFvs significantly blocked the ADCC reaction, but not the addition of a control scFv. Simultaneous incubation with a 125-fold molar excess of the CD16-specific monoclonal antibody 3G8, but not with a control IgG1, significantly reduced ADCC. Data points represent mean percent of specific lysis obtained with isolated MNCs from four different healthy donors at an E:T ratio of 40:1. Specific lysis measured for sctb HLA-ds16-hu19 was defined as 100%. Specific lysis is total lysis minus spontaneous lysis. *Statistically significant reduced (p ≤ 0.05) lysis.
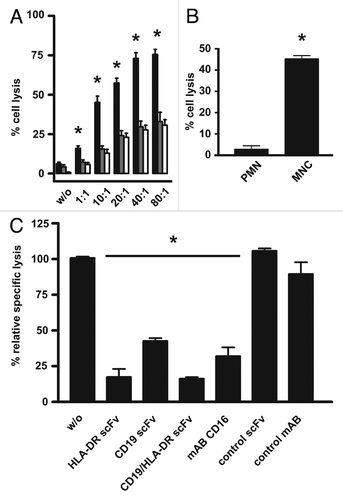
Figure 4 The dual-targeting sctb HLA-ds16-hu19 mediates potent lysis of CD19- and HLA-DR-positive Raji cells with isolated MNCs from healthy donors as effector cells. (A) At the concentration of 1 nM the sctb induced significant ADCC over a broad range of E:T ratios and the extent of specific lysis increased with increasing E:T ratios (black bars: sctb; gray bars: control sctb, white bars: no fusion protein). Data are presented as mean percentage lysis ± standard error of the mean (SEM) obtained with MNCs from four different healthy donors. *Statistically significant values, p ≤ 0.05. (B) Whole blood was fractionated into PMN and MNC to identify the relevant effector population for the sctb. Bars indicate sctb at a concentration of 1 nM. *Statistically significant (p ≤ 0.05) lysis. Data are acquired for four different donors. (C) Ag-specific induction of ADCC in the double-positive cell-line Raji by sctb HLA-ds16-hu19. The sctb induced potent lysis of Raji cells at a concentration of 1 nM. Simultaneous addition of a 500-fold molar excess of CD19- and HLA-DR-specific scFvs significantly blocked the ADCC reaction, but not the addition of a control scFv. Simultaneous incubation with a 125-fold molar excess of the CD16-specific monoclonal antibody 3G8, but not with a control IgG1, significantly reduced ADCC. Data points represent mean percent of specific lysis obtained with isolated MNCs from four different healthy donors at an E:T ratio of 40:1. Specific lysis measured for sctb HLA-ds16-hu19 was defined as 100%. Specific lysis is total lysis minus spontaneous lysis. *Statistically significant reduced (p ≤ 0.05) lysis.

Figure 5 Dose dependent induction of ADCC of the Raji tumor cell line by the sctb and the bsscFvs and test for selective lysis. The CD19- and HLA-DR-double-positive tumor cell line Raji (A) was used as target to compare efficacy of the fusion proteins at a constant E:T ratio of 40:1. The sctb (filled squares), the bsscFv hu19-ds16 (open triangles) and the bsscFv HLA-ds16 (filled inverted triangles) triggered ADCC in a dose-dependent manner. The non-relevant control bsscFv (filled diamonds) induced no significant killing. Data points represent mean percentage of lysis ± SEM obtained with isolated MNCs from 8 different healthy donors. *Statistically significant differences (p ≤ 0.05) between lysis induced by sctb and the bsscFvs. (B) For the first arm of the experiment (left bar), ag double-positive EZK 20 cells were labeled with 51Cr and mixed with an equal number of unlabeled HLA-DR single-positive EZK-HLA 16 cells (). For the second arm (right bar), single-positive EZK HLA 16 cells were labeled with 51Cr and mixed with an equal number of unlabeled double-positive EZK 20 cells. Sctb HLA-ds16-hu19 was added to a final concentration of 1 nM and MNCs were added to reach an E:T ratio of 40:1. The dual-targeting sctb (gray bar) induced statistically significant greater lysis of the double-positive cells in comparison to the lysis of the single-positive cells. Data points represent mean percentage of lysis ± SEM obtained with isolated MNCs from 4 different healthy donors. *Statistically significant (p ≤ 0.05) differences of lysis induced by the dual-targeting sctb.
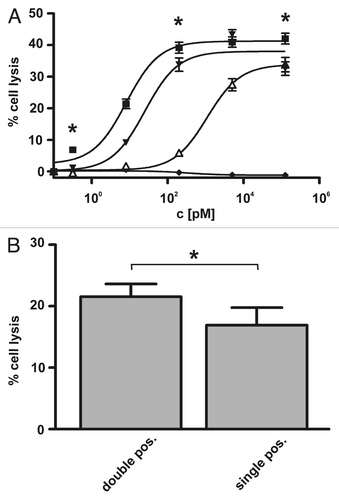
Figure 5 Dose dependent induction of ADCC of the Raji tumor cell line by the sctb and the bsscFvs and test for selective lysis. The CD19- and HLA-DR-double-positive tumor cell line Raji (A) was used as target to compare efficacy of the fusion proteins at a constant E:T ratio of 40:1. The sctb (filled squares), the bsscFv hu19-ds16 (open triangles) and the bsscFv HLA-ds16 (filled inverted triangles) triggered ADCC in a dose-dependent manner. The non-relevant control bsscFv (filled diamonds) induced no significant killing. Data points represent mean percentage of lysis ± SEM obtained with isolated MNCs from 8 different healthy donors. *Statistically significant differences (p ≤ 0.05) between lysis induced by sctb and the bsscFvs. (B) For the first arm of the experiment (left bar), ag double-positive EZK 20 cells were labeled with 51Cr and mixed with an equal number of unlabeled HLA-DR single-positive EZK-HLA 16 cells (Table 4). For the second arm (right bar), single-positive EZK HLA 16 cells were labeled with 51Cr and mixed with an equal number of unlabeled double-positive EZK 20 cells. Sctb HLA-ds16-hu19 was added to a final concentration of 1 nM and MNCs were added to reach an E:T ratio of 40:1. The dual-targeting sctb (gray bar) induced statistically significant greater lysis of the double-positive cells in comparison to the lysis of the single-positive cells. Data points represent mean percentage of lysis ± SEM obtained with isolated MNCs from 4 different healthy donors. *Statistically significant (p ≤ 0.05) differences of lysis induced by the dual-targeting sctb.

Table 1 KD-values and stability in human serum for sctb HLA-ds16-hu19 and bsscFvs hu19-ds16 and HLA-ds16

Table 2 EC50 for ADCC by sctb HLA-ds16-hu19 and bsscFvs hu19-ds16, HLA-ds16Table Footnotea

Table 3 Ag-density of stably transfected HEK 293 clone EZK20 over 3 consecutive passages

Table 4 Antigen-density of the double- and single-positive single cell clonesTable Footnotea

Supplemental material

Additional material

Download Zip (221.3 KB)

Reprints and Corporate Permissions

Please note: Selecting permissions does not provide access to the full text of the article, please see our help page How do I view content?

To request a reprint or corporate permissions for this article, please click on the relevant link below:

Academic Permissions

Please note: Selecting permissions does not provide access to the full text of the article, please see our help page How do I view content?

Obtain permissions instantly via Rightslink by clicking on the button below:

If you are unable to obtain permissions via Rightslink, please complete and submit this Permissions form. For more information, please visit our Permissions help page.