606
Views
9
CrossRef citations to date
0
Altmetric
Author's View

Combining targeted therapy with immunotherapy (interferon-α)

Rational, efficacy in gastrointestinal stromal tumor model and implications in other malignancies

, , , &
Pages 773-776 | Published online: 24 Aug 2012

Figures & data

Figure 1. IM binding to activated KIT (top panel) and remission duration post-combination treatment with IM plus peginterferon α-2b in GISTCitation6 (lower panel). (A-B), 3D ribbon diagram of IM binding to activated KIT. Red, IM; green, activation loop; green dotted line, hydrogen bonds; gold, key amino acids. IM forms critical hydrogen bonds to neighboring amino acids Thr670, Cys673, Glu640 and Asp810. Val654 is in a key position supporting the correct alignment of the key hydrogen bonds of IM to Thr670 and Asp810 (DFG motif). There are two additional critical hydrogen bonds, one between Arg796 and Tyr823 (activation loop), another one between Arg796 and Asp792 (A). Any amino acid substitution in these key positions can disrupt the critical conformation and impede IM binding. Two such examples, missense mutation Val654Ala and Tyr823Asp are shown (B) Val654Ala resulted in loss of hydrophobic support of IM, and missense mutation Tyr823Asp resulted in loss of hydrogen bonds with Arg796. (C) 2D binding interactions of IM with neighboring amino acids, hydrogen bonds are show as green (H-bond interaction with amino acid main chain) and blue (H-bond interaction with amino acid side chain) arrows. Pi stacking interactions are shown as orange lines. Residues involved in hydrogen-bond, charge or polar interactions are shown as pink circles. Residues involved in van der Waals interactions are shown as green circles. (D) Remission duration post-combination treatment after median follow-up of 3.9 y (4.6 – 3.5 y, calculated as of 02/15/2012), five patients are in continuing PR/CR (Pts#1, 2, 4, 5, 8), much improved comparing to the median-genotype-specific-PFS of Phase III S0033 IM monotherapy trial (yellow bars). Pt#3 presented with Stage IV aggressive GIST harboring KIT exon 11 deletion, extensive liver metastasis, mitotic figure ≥ 40/high power field, had swift excellent response achieving PR within 8 weeks, but progressed with PFS slightly longer than two years. Pt#6 developed IM-resistance, and re-initiation of peginterferon α-2b resulted in second PR. Pt#6 progressed again while off all treatment, and combination treatment of sunitinib plus peginterferon α-2b resulted in stable disease (B, last column).
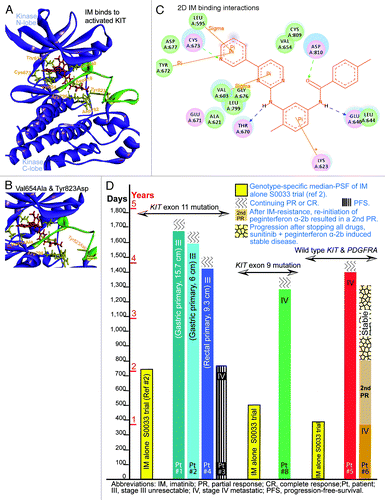
Figure 1. IM binding to activated KIT (top panel) and remission duration post-combination treatment with IM plus peginterferon α-2b in GISTCitation6 (lower panel). (A-B), 3D ribbon diagram of IM binding to activated KIT. Red, IM; green, activation loop; green dotted line, hydrogen bonds; gold, key amino acids. IM forms critical hydrogen bonds to neighboring amino acids Thr670, Cys673, Glu640 and Asp810. Val654 is in a key position supporting the correct alignment of the key hydrogen bonds of IM to Thr670 and Asp810 (DFG motif). There are two additional critical hydrogen bonds, one between Arg796 and Tyr823 (activation loop), another one between Arg796 and Asp792 (A). Any amino acid substitution in these key positions can disrupt the critical conformation and impede IM binding. Two such examples, missense mutation Val654Ala and Tyr823Asp are shown (B) Val654Ala resulted in loss of hydrophobic support of IM, and missense mutation Tyr823Asp resulted in loss of hydrogen bonds with Arg796. (C) 2D binding interactions of IM with neighboring amino acids, hydrogen bonds are show as green (H-bond interaction with amino acid main chain) and blue (H-bond interaction with amino acid side chain) arrows. Pi stacking interactions are shown as orange lines. Residues involved in hydrogen-bond, charge or polar interactions are shown as pink circles. Residues involved in van der Waals interactions are shown as green circles. (D) Remission duration post-combination treatment after median follow-up of 3.9 y (4.6 – 3.5 y, calculated as of 02/15/2012), five patients are in continuing PR/CR (Pts#1, 2, 4, 5, 8), much improved comparing to the median-genotype-specific-PFS of Phase III S0033 IM monotherapy trial (yellow bars). Pt#3 presented with Stage IV aggressive GIST harboring KIT exon 11 deletion, extensive liver metastasis, mitotic figure ≥ 40/high power field, had swift excellent response achieving PR within 8 weeks, but progressed with PFS slightly longer than two years. Pt#6 developed IM-resistance, and re-initiation of peginterferon α-2b resulted in second PR. Pt#6 progressed again while off all treatment, and combination treatment of sunitinib plus peginterferon α-2b resulted in stable disease (B, last column).