1,338
Views
54
CrossRef citations to date
0
Altmetric
Research Paper

Cross-priming for antitumor CTL induced by soluble Ag + polyI:C depends on the TICAM-1 pathway in mouse CD11c+/CD8α+ dendritic cells

, , , &
Pages 581-592 | Published online: 24 Aug 2012

Figures & data

Figure 1. PolyI:C induces CTL-mediated tumor regression. (A) WT mice were challenged with EG7 cells and were treated with PBS (●), EG7 lysates (▲), polyI:C (◆) and EG7 lysates + polyI:C (■). The adjuvant therapy was started at the time indicated by the arrow and the indicated reagents injected twice per week. One of the two PBS groups (○) and one of the two EG7 lysates + polyI:C groups (◻) were treated with anti-CD8β ascites in order to deplete CD8+ T cells once a week. Each group had 3–5 mice. (B) Draining inguinal LNs were harvested 24 h after the last treatment and the proportion of CD69-expressing CD8+ cells were counted. (C) LN cells were co-cultured with MMC-treated EG7 cells for 3 d and subjected to 51Cr release assay to evaluate CTL activity. E/T = 50. All error bars used in this figure show ± SEM. Data are representative of two independent experiments. One-way analysis of variance (ANOVA) with Bonferroni’s test was performed to analyze statistical significance. **, p < 0.01.
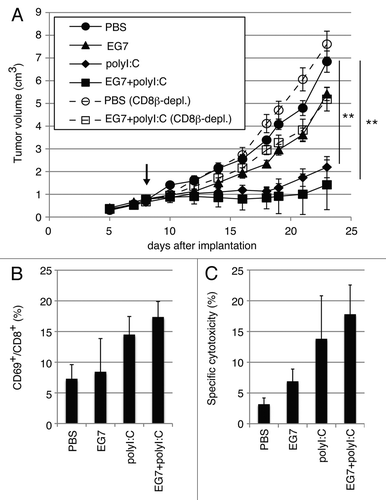
Figure 1. PolyI:C induces CTL-mediated tumor regression. (A) WT mice were challenged with EG7 cells and were treated with PBS (●), EG7 lysates (▲), polyI:C (◆) and EG7 lysates + polyI:C (■). The adjuvant therapy was started at the time indicated by the arrow and the indicated reagents injected twice per week. One of the two PBS groups (○) and one of the two EG7 lysates + polyI:C groups (◻) were treated with anti-CD8β ascites in order to deplete CD8+ T cells once a week. Each group had 3–5 mice. (B) Draining inguinal LNs were harvested 24 h after the last treatment and the proportion of CD69-expressing CD8+ cells were counted. (C) LN cells were co-cultured with MMC-treated EG7 cells for 3 d and subjected to 51Cr release assay to evaluate CTL activity. E/T = 50. All error bars used in this figure show ± SEM. Data are representative of two independent experiments. One-way analysis of variance (ANOVA) with Bonferroni’s test was performed to analyze statistical significance. **, p < 0.01.

Figure 2. PolyI:C-induced tumor retardation is dependent on the TICAM-1 pathway. Antitumor effect of polyI:C on various KO mice were evaluated by using in vivo mouse tumor implant model. EG7 cells were inoculated to WT (A), TICAM-1−/− (B), IPS-1−/− (C) and DKO mice (D) on day 0. PBS (●), EG7 lysates (▲) or EG7 lysates + polyI:C (■) were s.c. administered around the tumor. The adjuvant therapies were started at the time indicated by the arrows and injected twice per week. Each group have 3–4 mice and error bar shows ± SEM. Data are representative of two independent experiments. **, p < 0.01
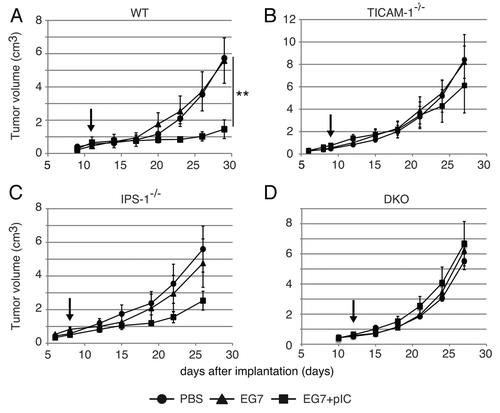
Figure 2. PolyI:C-induced tumor retardation is dependent on the TICAM-1 pathway. Antitumor effect of polyI:C on various KO mice were evaluated by using in vivo mouse tumor implant model. EG7 cells were inoculated to WT (A), TICAM-1−/− (B), IPS-1−/− (C) and DKO mice (D) on day 0. PBS (●), EG7 lysates (▲) or EG7 lysates + polyI:C (■) were s.c. administered around the tumor. The adjuvant therapies were started at the time indicated by the arrows and injected twice per week. Each group have 3–4 mice and error bar shows ± SEM. Data are representative of two independent experiments. **, p < 0.01

Figure 3. CD8 T cells in the draining LNs are activated through the TICAM-1 pathway by polyI:C. Draining inguinal LNs were harvested from tumor-bearing mice 24 h after the last treatment. LN cells were stained with CD3ε, CD8α and CD69, and the cells gated on CD3ε+CD8α+ are shown (A). Spleen cells in each group of mice were stained separately, the CD8 levels in gated cells being variably distributed in FACS analyses. The average frequency of activated CD8 T cells defined by CD69 expression is shown (B). Alternatively, LN cells from the indicated mice were cultured for further 3 d in vitro and IL-2 production was measured by CBA assay (C).
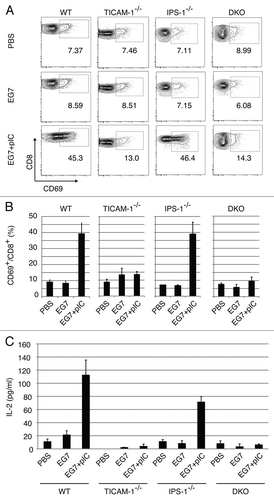
Figure 3. CD8 T cells in the draining LNs are activated through the TICAM-1 pathway by polyI:C. Draining inguinal LNs were harvested from tumor-bearing mice 24 h after the last treatment. LN cells were stained with CD3ε, CD8α and CD69, and the cells gated on CD3ε+CD8α+ are shown (A). Spleen cells in each group of mice were stained separately, the CD8 levels in gated cells being variably distributed in FACS analyses. The average frequency of activated CD8 T cells defined by CD69 expression is shown (B). Alternatively, LN cells from the indicated mice were cultured for further 3 d in vitro and IL-2 production was measured by CBA assay (C).

Figure 4. TICAM-1 and IRF-3/7 are essential for polyI:C-induced antigen-specific CTL expansion. WT, TICAM-1−/−, IPS-1−/−, TICAM-1/IPS-1 DKO and IRF-3/7−/− mice were i.p. administered with the combination of OVA and polyI:C. After 7days, splenocytes were harvested and stained with CD8α and OVA tetramer (A). The average percentages of OVA-specific CTL are shown (B). Alternatively, splenocytes were cultured in vitro in the presence of SL8 for 8 h and IFNγ production was measured by intracellular cytokine staining (C). To assess the killing activity, in vivo CTL assay was performed. The combinations of OVA and polyI:C were administered i.v. to each group of mice and 5 d later, cytotoxicity was measured (D). The data shown are collaborate or representative of at least three independent experiments. One-way analysis of variance (ANOVA) with Bonferroni’s test was performed to analyze statistical significance. *, p < 0.05; **, p < 0.01; ***, p < 0.001.
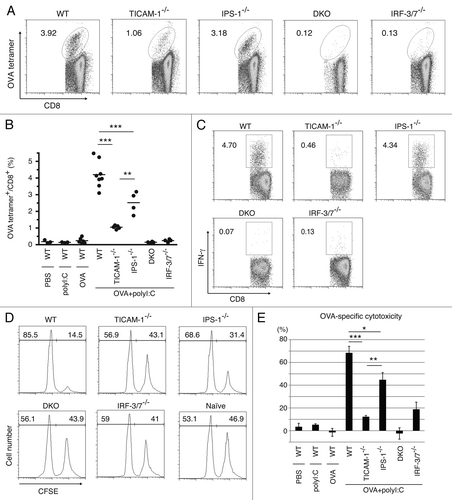
Figure 4. TICAM-1 and IRF-3/7 are essential for polyI:C-induced antigen-specific CTL expansion. WT, TICAM-1−/−, IPS-1−/−, TICAM-1/IPS-1 DKO and IRF-3/7−/− mice were i.p. administered with the combination of OVA and polyI:C. After 7days, splenocytes were harvested and stained with CD8α and OVA tetramer (A). The average percentages of OVA-specific CTL are shown (B). Alternatively, splenocytes were cultured in vitro in the presence of SL8 for 8 h and IFNγ production was measured by intracellular cytokine staining (C). To assess the killing activity, in vivo CTL assay was performed. The combinations of OVA and polyI:C were administered i.v. to each group of mice and 5 d later, cytotoxicity was measured (D). The data shown are collaborate or representative of at least three independent experiments. One-way analysis of variance (ANOVA) with Bonferroni’s test was performed to analyze statistical significance. *, p < 0.05; **, p < 0.01; ***, p < 0.001.

Figure 5. TICAM-1 in CD8α+ DC is more important than IPS-1 in polyI:C-induced cross-priming. OVA and polyI:C were administered i.v. and 4 h later, CD8α+ and CD8α- DC were isolated from the spleen. CD86 and CD40 expressions were determined by FACS (A). Filled gray and black line show isotype control and target expression, respectively. Alternatively, CD8α+ and CD8α- DC were co-cultured with CFSE-labeled RAG2−/−/OT-1 T cells for 3 d. The cross-priming activity of each DC subset was determined with sequential dilution of CFSE (B) and IFNγ production (C). IFNγ was measured by CBA assay. The data shown are representative of two independent experiments. Err bar shows SD.
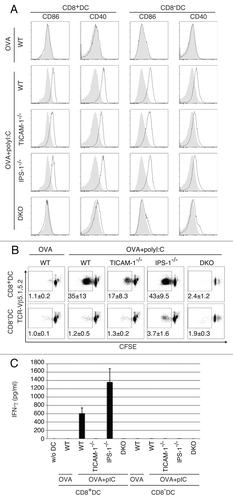
Figure 5. TICAM-1 in CD8α+ DC is more important than IPS-1 in polyI:C-induced cross-priming. OVA and polyI:C were administered i.v. and 4 h later, CD8α+ and CD8α- DC were isolated from the spleen. CD86 and CD40 expressions were determined by FACS (A). Filled gray and black line show isotype control and target expression, respectively. Alternatively, CD8α+ and CD8α- DC were co-cultured with CFSE-labeled RAG2−/−/OT-1 T cells for 3 d. The cross-priming activity of each DC subset was determined with sequential dilution of CFSE (B) and IFNγ production (C). IFNγ was measured by CBA assay. The data shown are representative of two independent experiments. Err bar shows SD.

Figure 6. PolyI:C encounters TLR3 in CD8α+ DC. CD8α+ and CD8α- DC were isolated by FACSAriaII and stimulated with 20 µg/ml TexasRed-polyI:C for 2 h. Then cells were stained with Alexa647-antiTLR3 and subjected to confocal microscopic analysis (A). Alternatively, splenic DC isolated by MACS were incubated with FITC-polyI:C for the time shown in figure and analyzed the degrees of polyI:C uptake by FACS (B). Data shown are the representative of three independent experiments.
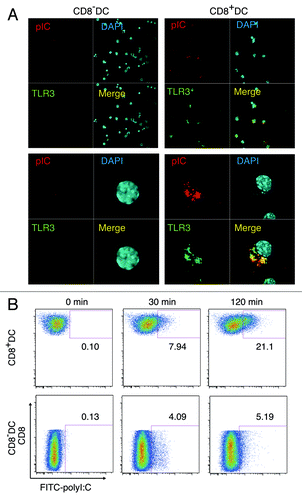
Figure 6. PolyI:C encounters TLR3 in CD8α+ DC. CD8α+ and CD8α- DC were isolated by FACSAriaII and stimulated with 20 µg/ml TexasRed-polyI:C for 2 h. Then cells were stained with Alexa647-antiTLR3 and subjected to confocal microscopic analysis (A). Alternatively, splenic DC isolated by MACS were incubated with FITC-polyI:C for the time shown in figure and analyzed the degrees of polyI:C uptake by FACS (B). Data shown are the representative of three independent experiments.
Supplemental material

Additional material

Download Zip (2.3 MB)