1,010
Views
18
CrossRef citations to date
0
Altmetric
Research Paper

Environment-mediated drug resistance in Bcr/Abl-positive acute lymphoblastic leukemia

, , , , , , , & show all
Pages 618-629 | Published online: 24 Aug 2012

Figures & data

Figure 1. EMDR to two drugs with a different mechanism of action is accompanied by differential expression of common genes. Schematic illustration summarizing the results of gene expression profiling on two different pro-B lymphoblastic leukemia cell lines (8093 and B2) from BCR/ABL transgenic mice, that developed EMDR during treatment with nilotinib or lonafarnib in the presence of stroma. For each condition, the most up- and downregulated genes (lower part and upper part of the heatmap, respectively) are shown. Red and green represent the individual up-/downregulation values, respectively.
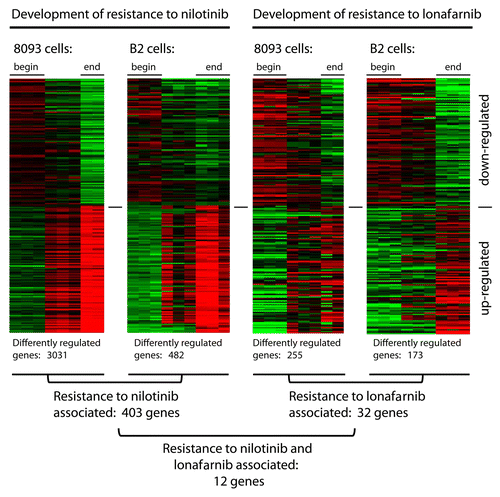
Figure 1. EMDR to two drugs with a different mechanism of action is accompanied by differential expression of common genes. Schematic illustration summarizing the results of gene expression profiling on two different pro-B lymphoblastic leukemia cell lines (8093 and B2) from BCR/ABL transgenic mice, that developed EMDR during treatment with nilotinib or lonafarnib in the presence of stroma. For each condition, the most up- and downregulated genes (lower part and upper part of the heatmap, respectively) are shown. Red and green represent the individual up-/downregulation values, respectively.

Table 1. Genes showing increased expression during the acquisition of EMDR to both nilotinib or lonafarnib.

Figure 2. Large-scale upregulation of inflammatory-associated gene products in 8093 and B2 BCR/ABL lymphoblastic leukemia cells that developed EMDR to nilotinib. Functional grouping of genes related to inflammation, which show significant changes in expression during the development of EMDR. Shown are the average up-/downregulation values of each time point during nilotinib treatment of the two ALL cell lines 8093 and B2: b = begin of treatment (day 0); m = midpoint (maximal reduction of cell viability as a consequence of drug treatment); e = endpoint (full recovery of drug treated ALL cells that developed EMDR). Red and green represent the individual up-/downregulation values, respectively. Absolute log-transformed, corrected microarray values were used of biological triplicates ± SEM.
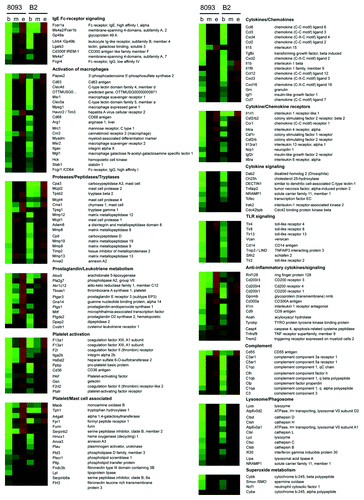
Figure 2. Large-scale upregulation of inflammatory-associated gene products in 8093 and B2 BCR/ABL lymphoblastic leukemia cells that developed EMDR to nilotinib. Functional grouping of genes related to inflammation, which show significant changes in expression during the development of EMDR. Shown are the average up-/downregulation values of each time point during nilotinib treatment of the two ALL cell lines 8093 and B2: b = begin of treatment (day 0); m = midpoint (maximal reduction of cell viability as a consequence of drug treatment); e = endpoint (full recovery of drug treated ALL cells that developed EMDR). Red and green represent the individual up-/downregulation values, respectively. Absolute log-transformed, corrected microarray values were used of biological triplicates ± SEM.

Figure 3. Increased expression of inflammation-associated genes during EMDR. (A) western blot analysis of samples from B2 on day 14 DMSO (-), on day 14 nilotinib (+) and on day 19 lonafarnib (+); from 8093 on day 14 DMSO (-), on day 9 nilotinib (+) and on day 14 lonafarnib (+). (B) Real-time RT/PCR on 8093 cells treated with 16 nM nilotinib in the presence of stroma as indicated. White bar, DMSO-treated cells; gray bar, t = 3 d of nilotinib treatment; black bar, t = 9 d. Results are expressed as % of that of gapdh gene expression. Bars represent mean ± SEM of triplicate samples. Samples independent of those used for the microarray. (C) Murine ccl3 levels were measured during the course of EMDR in the supernatant of the indicated cells treated with nilotinib using an ELISA. Samples independent of those used in other experiments. *p < 0.05; **p < 0.01; ***p < 0.001 when compared with start. (D) western blot analysis of Mmp9 protein. Lane 1, untreated 8093 cells; lane 2, 8093 cells at day 11 resistant to nilotinib; lane 3, 8093 cells at day 18 resistant to lonafarnib. Mmp9 proteins include 92 kDa, 82 N-terminal cleaved and 65 kDa C-terminal cleaved forms (indicated with arrowheads). Bottom panel, GAPDH loading control of the same samples. (E) Zymography on samples taken on the indicated days of 8093 cells treated with DMSO or 0.3 μM nilotinib. The arrow points to Mmp9 activity. Positive control for Mmp9 activity (c) mouse spleen lysates. The position of molecular weight standards is indicated to the left. A negative of the original zymogram is shown. The image B, D, and E show a representative result of experiments repeated at least once.
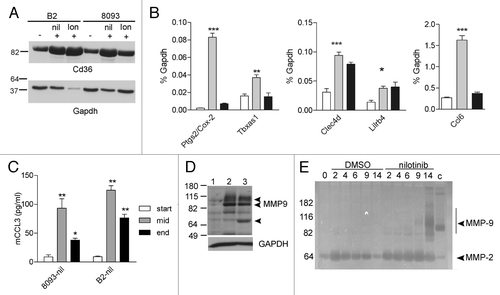
Figure 3. Increased expression of inflammation-associated genes during EMDR. (A) western blot analysis of samples from B2 on day 14 DMSO (-), on day 14 nilotinib (+) and on day 19 lonafarnib (+); from 8093 on day 14 DMSO (-), on day 9 nilotinib (+) and on day 14 lonafarnib (+). (B) Real-time RT/PCR on 8093 cells treated with 16 nM nilotinib in the presence of stroma as indicated. White bar, DMSO-treated cells; gray bar, t = 3 d of nilotinib treatment; black bar, t = 9 d. Results are expressed as % of that of gapdh gene expression. Bars represent mean ± SEM of triplicate samples. Samples independent of those used for the microarray. (C) Murine ccl3 levels were measured during the course of EMDR in the supernatant of the indicated cells treated with nilotinib using an ELISA. Samples independent of those used in other experiments. *p < 0.05; **p < 0.01; ***p < 0.001 when compared with start. (D) western blot analysis of Mmp9 protein. Lane 1, untreated 8093 cells; lane 2, 8093 cells at day 11 resistant to nilotinib; lane 3, 8093 cells at day 18 resistant to lonafarnib. Mmp9 proteins include 92 kDa, 82 N-terminal cleaved and 65 kDa C-terminal cleaved forms (indicated with arrowheads). Bottom panel, GAPDH loading control of the same samples. (E) Zymography on samples taken on the indicated days of 8093 cells treated with DMSO or 0.3 μM nilotinib. The arrow points to Mmp9 activity. Positive control for Mmp9 activity (c) mouse spleen lysates. The position of molecular weight standards is indicated to the left. A negative of the original zymogram is shown. The image B, D, and E show a representative result of experiments repeated at least once.

Figure 4. ALL cells in the bone marrow of BCR/ABL transgenic mice show elevated expression of genes related to inflammation during treatment with nilotinib. Gene array results of transcriptionally upregulated genes of transgenic BCR/ABL mice and, as a comparison, from the two murine BCR/ABL-positive leukemia cell lines, 8093 and B2, are shown. Up- and downregulation of gene expression during the development of EMDR to nilotinib is visualized by a heatmap (expression values are log transformed and up-/downregulation ratios are visualized by red and green color intensity, respectively). Gene array results represent the average level of gene expression from three individual experiments for the different stages during development of EMDR (ex vivo: b, untreated leukemia cells; m, mid point; e, development of nilotinib resistance/end point; in vivo: w, AA4.1+, CD19+ pro-B cells from wild type mice; p, pre-leukemic AA4.1+ CD19+ pro-B cells from BCR/ABL transgenic mice; l, AA4.1+ CD19+ pro-B cells lymphoblastic leukemia cells from transgenic mice; n, AA4.1+ CD19+ pro-B cells lymphoblastic leukemia cells from BCR/ABL mice treated for 8 d with nilotinib). Genes related to inflammation are accentuated by gray boxes.
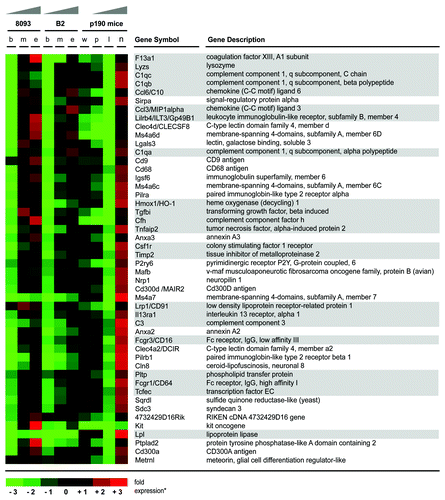
Figure 4. ALL cells in the bone marrow of BCR/ABL transgenic mice show elevated expression of genes related to inflammation during treatment with nilotinib. Gene array results of transcriptionally upregulated genes of transgenic BCR/ABL mice and, as a comparison, from the two murine BCR/ABL-positive leukemia cell lines, 8093 and B2, are shown. Up- and downregulation of gene expression during the development of EMDR to nilotinib is visualized by a heatmap (expression values are log transformed and up-/downregulation ratios are visualized by red and green color intensity, respectively). Gene array results represent the average level of gene expression from three individual experiments for the different stages during development of EMDR (ex vivo: b, untreated leukemia cells; m, mid point; e, development of nilotinib resistance/end point; in vivo: w, AA4.1+, CD19+ pro-B cells from wild type mice; p, pre-leukemic AA4.1+ CD19+ pro-B cells from BCR/ABL transgenic mice; l, AA4.1+ CD19+ pro-B cells lymphoblastic leukemia cells from transgenic mice; n, AA4.1+ CD19+ pro-B cells lymphoblastic leukemia cells from BCR/ABL mice treated for 8 d with nilotinib). Genes related to inflammation are accentuated by gray boxes.

Figure 5. Emergence of EMDR in lymphoblastic leukemia cells during treatment with nilotinib or lonafarnib is accompanied by activation of major signal transduction pathways. Western blot analysis of samples from 8093 cells treated with 20 nM nilotinib (A) or B2 treated with 0.25 μM lonafarnib (B) isolated during a time course of developing EMDR. Samples independent from those of the microarray; single experiment. The location of molecular weight markers (kDa) is indicated in the different panels. Numbers above the lanes show the day of sampling.
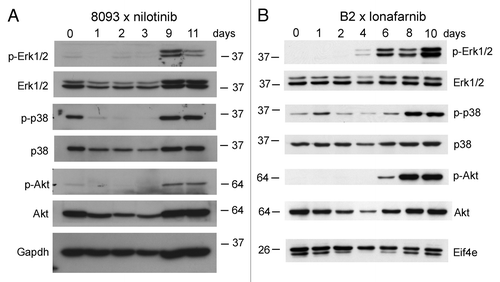
Figure 5. Emergence of EMDR in lymphoblastic leukemia cells during treatment with nilotinib or lonafarnib is accompanied by activation of major signal transduction pathways. Western blot analysis of samples from 8093 cells treated with 20 nM nilotinib (A) or B2 treated with 0.25 μM lonafarnib (B) isolated during a time course of developing EMDR. Samples independent from those of the microarray; single experiment. The location of molecular weight markers (kDa) is indicated in the different panels. Numbers above the lanes show the day of sampling.

Figure 6. Inhibition of Erk, Akt and JNK pathways inhibits drug tolerance to nilotinib. 8093 ALL cells were treated with control DMSO, 16 nM nilotinib, or inhibitors of different pathways alone or combined with nilotinib. Inhibitors used include (A) 10 μM of the MEK inhibitor U0126, (B) 50 nM of the Akt inhibitor Triciribine (C) 10 μM of the JNK inhibitor SP600125 and (D) 20 μM of the p38 inhibitor CAY10571 (an SB203580 analog). The graphs shown in B-E were generated in a single experiment; the graphs share the nilotinib-treated and DMSO-treated samples. The graph in A represents a separate experiment. Left panels, viability (% viable cell counts/total cell counts). (E) Total viable cell counts from B-D. Results shown are representative of three independently performed experiments.
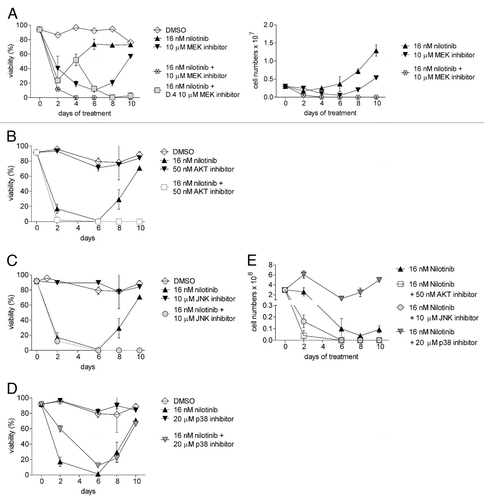
Figure 6. Inhibition of Erk, Akt and JNK pathways inhibits drug tolerance to nilotinib. 8093 ALL cells were treated with control DMSO, 16 nM nilotinib, or inhibitors of different pathways alone or combined with nilotinib. Inhibitors used include (A) 10 μM of the MEK inhibitor U0126, (B) 50 nM of the Akt inhibitor Triciribine (C) 10 μM of the JNK inhibitor SP600125 and (D) 20 μM of the p38 inhibitor CAY10571 (an SB203580 analog). The graphs shown in B-E were generated in a single experiment; the graphs share the nilotinib-treated and DMSO-treated samples. The graph in A represents a separate experiment. Left panels, viability (% viable cell counts/total cell counts). (E) Total viable cell counts from B-D. Results shown are representative of three independently performed experiments.
Supplemental material

Additional material

Download Zip (3.2 MB)