3,043
Views
212
CrossRef citations to date
0
Altmetric
Original Research

Dendritic cell exosomes directly kill tumor cells and activate natural killer cells via TNF superfamily ligands

, , , &
Pages 1074-1083 | Received 01 Dec 2011, Accepted 26 May 2012, Published online: 01 Oct 2012

Figures & data

Figure 1. Purified DCex have oval-biconcave shape, 30 to 100 nm in diameter and DC phenotype. iDC and mDC were generated by culturing linage marker-negative bone marrow cells in the presence of GM-CSF/IL4 and GM-CSF/IL4/LPS, respectively. DCex were isolated from conditioned media of these DC cultures using fractionated centrifugation and filtrations. Morphology (A) and surface markers (B) of purified DCex were examined by TEM and flow cytometry, respectively. (A) Purified iDCex either unbound or bound to anti-Class II MHC antibody-coated beads were processed for and examined using TEM. The left and the upper right panels of TEM micrographs of purified DCex show several 30–100 nm diameter oval-biconcave structures. The lower right panel is a TEM micrograph of a DCex bound to anti-Class II MHC antibody-coated beads showing a section of an oval structure having an electron-dense double layer membrane structure that surrounds an electron-clear material (indicated with the arrow), attached to amorphous bead structure. (B) Purified iDCex and mDCex were captured onto anti-Class II MHC antibody-coated beads, stained with fluorochrome-conjugated antibodies specific for the DC markers Class I MHC (αMHC I), Class II MHC (αMHC II), CD80 (αCD80), CD86 (αCD86), CD40 (αCD40) and CD14 (αCD14), as well as isotype control antibodies (Isotype), and analyzed by flow cytometry. Data are mean fluorescence intensity (MFI) of a representative experiment of 4 independent experiments performed.
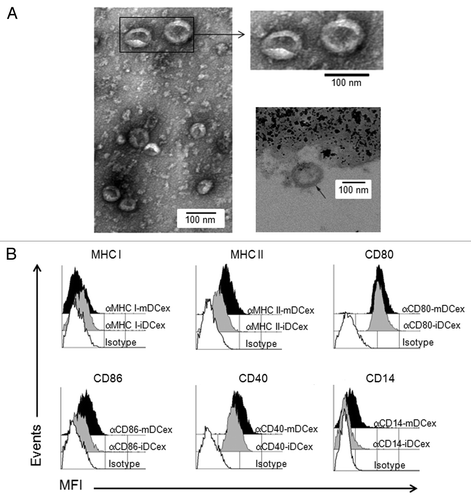
Figure 1. Purified DCex have oval-biconcave shape, 30 to 100 nm in diameter and DC phenotype. iDC and mDC were generated by culturing linage marker-negative bone marrow cells in the presence of GM-CSF/IL4 and GM-CSF/IL4/LPS, respectively. DCex were isolated from conditioned media of these DC cultures using fractionated centrifugation and filtrations. Morphology (A) and surface markers (B) of purified DCex were examined by TEM and flow cytometry, respectively. (A) Purified iDCex either unbound or bound to anti-Class II MHC antibody-coated beads were processed for and examined using TEM. The left and the upper right panels of TEM micrographs of purified DCex show several 30–100 nm diameter oval-biconcave structures. The lower right panel is a TEM micrograph of a DCex bound to anti-Class II MHC antibody-coated beads showing a section of an oval structure having an electron-dense double layer membrane structure that surrounds an electron-clear material (indicated with the arrow), attached to amorphous bead structure. (B) Purified iDCex and mDCex were captured onto anti-Class II MHC antibody-coated beads, stained with fluorochrome-conjugated antibodies specific for the DC markers Class I MHC (αMHC I), Class II MHC (αMHC II), CD80 (αCD80), CD86 (αCD86), CD40 (αCD40) and CD14 (αCD14), as well as isotype control antibodies (Isotype), and analyzed by flow cytometry. Data are mean fluorescence intensity (MFI) of a representative experiment of 4 independent experiments performed.

Figure 2. DCex express TNF superfamily ligands. (A,B) Quantification of surface-associated and total TNFSFLs of DCex. Untreated (Intact) or lysed (Lysed) iDCex and mDCex were examined by ELISA for the presence and quantity of surface-associated and total TNFSFL, respectively. TNF (A) and FasL (B) were measured using ELISA. Data are means + SD of triplicates pg/100 μg DCex. Asterisks indicate statistical significance (***, p < 0.001) of data differences between Intact iDCex vs. Intact mDCex, Lysed iDCex vs. Lysed mDCex in A; Intact iDCex vs. Intact mDCex, Intact vs. Lysed iDCex, and Intact vs Lysed mDCex in B. C. Analyses of DCex membrane-bound TNFSFLs. Purified intact iDCex and mDCex were bound to 2.8 μm Dynabeads coated with anti-class II MHC antibody, stained with fluorochrome-conjugated anti-TNF (αTNF), anti-FasL (αFasL), anti-TRAIL (αTRAIL) or isotype control (Isotype) antibodies. Data are MFI from a representative experiment of 4 experiments performed.
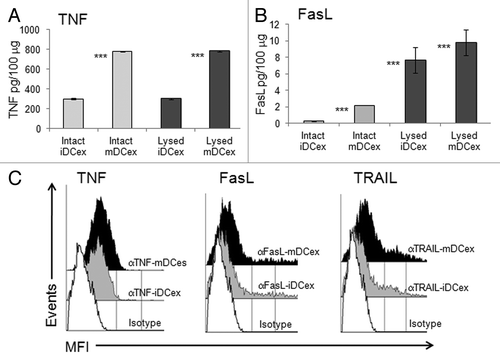
Figure 2. DCex express TNF superfamily ligands. (A,B) Quantification of surface-associated and total TNFSFLs of DCex. Untreated (Intact) or lysed (Lysed) iDCex and mDCex were examined by ELISA for the presence and quantity of surface-associated and total TNFSFL, respectively. TNF (A) and FasL (B) were measured using ELISA. Data are means + SD of triplicates pg/100 μg DCex. Asterisks indicate statistical significance (***, p < 0.001) of data differences between Intact iDCex vs. Intact mDCex, Lysed iDCex vs. Lysed mDCex in A; Intact iDCex vs. Intact mDCex, Intact vs. Lysed iDCex, and Intact vs Lysed mDCex in B. C. Analyses of DCex membrane-bound TNFSFLs. Purified intact iDCex and mDCex were bound to 2.8 μm Dynabeads coated with anti-class II MHC antibody, stained with fluorochrome-conjugated anti-TNF (αTNF), anti-FasL (αFasL), anti-TRAIL (αTRAIL) or isotype control (Isotype) antibodies. Data are MFI from a representative experiment of 4 experiments performed.

Figure 3. DCex kill tumor cells. (A) iDCex and more potently mDCex kill tumor cells. Graded amounts of purified wild type (wt) mouse iDCex and mDCex were mixed with 2,500 B16 melanoma cells. The mixtures of DCex and tumor cells were incubated for 48 h, and cytotoxicity was determined using the MTT assay. (B) Time course of DCex killing of tumor cells. Fifty micrograms of wt mDCex were co-incubated with 2,500 B16 melanoma cells, and their cytotoxic activity was determined by MTT assay after 24 h, 48 h and 72 h of the incubation. (C) DCex kill not only melanoma cells but also cancer cells. 25, 50 and 100 μg of wt mDCex were co-incubated with 2,500 KLN205 squamous cell carcinoma or MC38 colon carcinoma cells for 48 h. After this incubation, cytotoxic activity of mDCex was determined by MTT assay. Data are representative of 2 experiments performed. They are % cytotoxicity means ± SD of triplicates. Statistical significance of cytotoxicity differences of mDCex vs. iDCex is indicated by asterisks (***, p < 0.001).
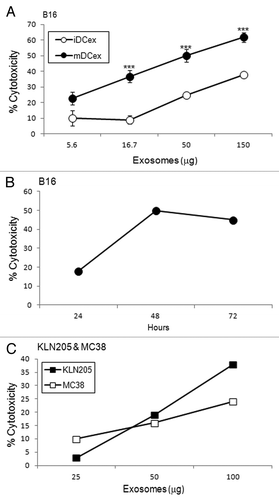
Figure 3. DCex kill tumor cells. (A) iDCex and more potently mDCex kill tumor cells. Graded amounts of purified wild type (wt) mouse iDCex and mDCex were mixed with 2,500 B16 melanoma cells. The mixtures of DCex and tumor cells were incubated for 48 h, and cytotoxicity was determined using the MTT assay. (B) Time course of DCex killing of tumor cells. Fifty micrograms of wt mDCex were co-incubated with 2,500 B16 melanoma cells, and their cytotoxic activity was determined by MTT assay after 24 h, 48 h and 72 h of the incubation. (C) DCex kill not only melanoma cells but also cancer cells. 25, 50 and 100 μg of wt mDCex were co-incubated with 2,500 KLN205 squamous cell carcinoma or MC38 colon carcinoma cells for 48 h. After this incubation, cytotoxic activity of mDCex was determined by MTT assay. Data are representative of 2 experiments performed. They are % cytotoxicity means ± SD of triplicates. Statistical significance of cytotoxicity differences of mDCex vs. iDCex is indicated by asterisks (***, p < 0.001).

Figure 4. DCex induce apoptosis in tumor cells via TNF superfamily ligands. A-B. DCex induce apoptosis in tumor cells. Fifty micrograms of wt mDCex were coincubated with 2,500 B16 melanoma cells in the presence of 2% DMSO or 200 μM Z-VAD-fmk for 5 h or 48 h and tested using the apoptosis specific Hoechst DNA hypo-staining (A) and MTT (B) assays, respectively. p value represents statistically significant differences between DCex cytotoxic activities in the presence of DMSO and Z-VAD-fmk C-D. DCex of TNF- (Tnf−/−) and FasL- (Fasl−/−) deficient mice have impaired antitumor cytotoxic activity. Mature Tnf−/− DCex (C) and Fasl−/− DCex (D) were compared with mature wtDCex for their abilities to kill B16 melanoma cells as measured using 48 h MTT assay. p values represent statistically significant differences between tumoricidal activities of wtDCex vs. Tnf−/− DCex or Fasl−/− DCex. E-F. Neutralization of TRAIL inhibits DCex-mediated tumoricidal activity. Fifty micrograms of wt mDCex were coincubated with 2,500 B16 melanoma cells in the presence of 20 μg of IgG control or anti-TRAIL antibodies for 5 h or 48 h and tested using the apoptosis specific DNA hypo-staining (E) and MTT (F) assays, respectively. p values represent statisticallly significant differences between DCex cytotoxic activities in the presence of IgG control and anti-TRAIL antibodies. Data are from representative experiments of 2 experiments performed and represent % cytotoxicity means ± SD of triplicates.
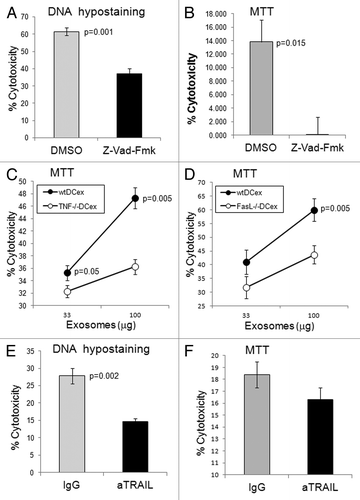
Figure 4. DCex induce apoptosis in tumor cells via TNF superfamily ligands. A-B. DCex induce apoptosis in tumor cells. Fifty micrograms of wt mDCex were coincubated with 2,500 B16 melanoma cells in the presence of 2% DMSO or 200 μM Z-VAD-fmk for 5 h or 48 h and tested using the apoptosis specific Hoechst DNA hypo-staining (A) and MTT (B) assays, respectively. p value represents statistically significant differences between DCex cytotoxic activities in the presence of DMSO and Z-VAD-fmk C-D. DCex of TNF- (Tnf−/−) and FasL- (Fasl−/−) deficient mice have impaired antitumor cytotoxic activity. Mature Tnf−/− DCex (C) and Fasl−/− DCex (D) were compared with mature wtDCex for their abilities to kill B16 melanoma cells as measured using 48 h MTT assay. p values represent statistically significant differences between tumoricidal activities of wtDCex vs. Tnf−/− DCex or Fasl−/− DCex. E-F. Neutralization of TRAIL inhibits DCex-mediated tumoricidal activity. Fifty micrograms of wt mDCex were coincubated with 2,500 B16 melanoma cells in the presence of 20 μg of IgG control or anti-TRAIL antibodies for 5 h or 48 h and tested using the apoptosis specific DNA hypo-staining (E) and MTT (F) assays, respectively. p values represent statisticallly significant differences between DCex cytotoxic activities in the presence of IgG control and anti-TRAIL antibodies. Data are from representative experiments of 2 experiments performed and represent % cytotoxicity means ± SD of triplicates.

Figure 5. DCex activate NK cells. (A) iDCex and more potently mDCex induce NK cell IFNγ secretion. One hundred μg of purified iDCex and mDCex were mixed with aNK cells, and incubated for 24 h. (B) DCex induce NK cell IFNγ secretion in a dose-dependent manner. Graded amounts of purified mDCex were mixed with aNK cells, and incubated for 24 h. After incubation, cell-free supernatants were separated and assessed for the presence and quantity of IFNγ using ELISA. Data are from a representative experiment of 2 experiments performed. They are means ± SD of triplicates IFNγ ng/0.5 × 106NK cells/mL. Asterisks indicate statistical significance of data differences: in (A), NK vs. NK+iDCex (*, p < 0.05), NK vs. NK+mDCex (***, p < 0.001), and NK+iDCex vs. NK+mDCex (***, p < 0.001); and in (B), NK (0) vs. NK+mDCex (*, p < 0.05; ***, p < 0.001).
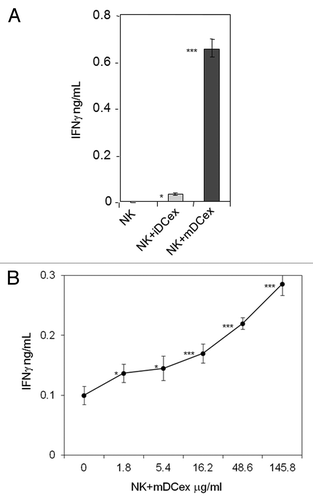
Figure 5. DCex activate NK cells. (A) iDCex and more potently mDCex induce NK cell IFNγ secretion. One hundred μg of purified iDCex and mDCex were mixed with aNK cells, and incubated for 24 h. (B) DCex induce NK cell IFNγ secretion in a dose-dependent manner. Graded amounts of purified mDCex were mixed with aNK cells, and incubated for 24 h. After incubation, cell-free supernatants were separated and assessed for the presence and quantity of IFNγ using ELISA. Data are from a representative experiment of 2 experiments performed. They are means ± SD of triplicates IFNγ ng/0.5 × 106NK cells/mL. Asterisks indicate statistical significance of data differences: in (A), NK vs. NK+iDCex (*, p < 0.05), NK vs. NK+mDCex (***, p < 0.001), and NK+iDCex vs. NK+mDCex (***, p < 0.001); and in (B), NK (0) vs. NK+mDCex (*, p < 0.05; ***, p < 0.001).

Figure 6. DCex mediate activation of NK cells via engagement of DCex TNF with NK cell TNF receptors. A. DCex of TNF-deficient mice (T−/− DCex) are unable to activate NK cells of wild type mice (wtNK). B. NK cells of TNFR1-deficient mice (R1−/− NK) have decreased responsiveness to DCex of wild type mice (wtDCex). C. NK cells of TNFR2-deficient mice (R2−/− NK) do not respond to wtDCex. wtNK cells alone, and their mixtures with 25 μg wtDCex or T−/− DCex (A); wtNK cells or R1−/− NK cells alone, and their mixtures with 25 μg of wtDCex (B); and wtNK cells or R2−/− NK cells alone, and their mixtures with 25 μg wtDCex (C) were incubated for 24 h. After incubation, cell-free supernatants were collected and tested for the presence and quantity of IFNγ using ELISA. Data are from a representative experiment of 2 experiments performed. They are means ± SD of IFN-γ ng/0.5 × 106 NK cells/mL. Asterisks indicate statistically significant differences in data from wtNK, R1−/− NK or R2−/− NK vs. wtNK+wtDCex, wtNK+wtDCex vs. wtNK+T−/−DCex; wtNK+wtDCex vs. R1−/−NK+wtDCex and R2−/−NK+wtDCex (***, p < 0.001).
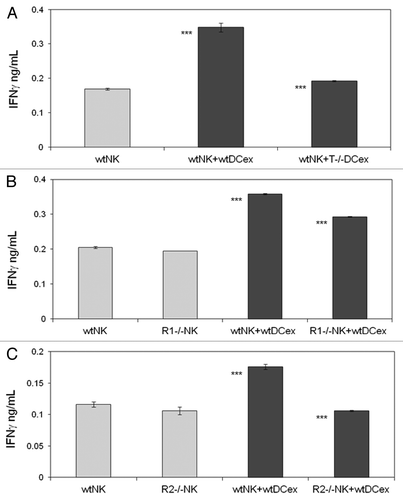
Figure 6. DCex mediate activation of NK cells via engagement of DCex TNF with NK cell TNF receptors. A. DCex of TNF-deficient mice (T−/− DCex) are unable to activate NK cells of wild type mice (wtNK). B. NK cells of TNFR1-deficient mice (R1−/− NK) have decreased responsiveness to DCex of wild type mice (wtDCex). C. NK cells of TNFR2-deficient mice (R2−/− NK) do not respond to wtDCex. wtNK cells alone, and their mixtures with 25 μg wtDCex or T−/− DCex (A); wtNK cells or R1−/− NK cells alone, and their mixtures with 25 μg of wtDCex (B); and wtNK cells or R2−/− NK cells alone, and their mixtures with 25 μg wtDCex (C) were incubated for 24 h. After incubation, cell-free supernatants were collected and tested for the presence and quantity of IFNγ using ELISA. Data are from a representative experiment of 2 experiments performed. They are means ± SD of IFN-γ ng/0.5 × 106 NK cells/mL. Asterisks indicate statistically significant differences in data from wtNK, R1−/− NK or R2−/− NK vs. wtNK+wtDCex, wtNK+wtDCex vs. wtNK+T−/−DCex; wtNK+wtDCex vs. R1−/−NK+wtDCex and R2−/−NK+wtDCex (***, p < 0.001).

Figure 7. Transmembrane TNF, but not soluble TNF, mediates DCex-induced activation of NK cells. NK cells alone, and NK cells mixed with 20 μg DCex in the presence of isotype control antibodies (Isotype), dominant negative TNF (DNTNF), which selectively sequestrates soluble TNF, anti-TNF XT22 antibody (αTNF), which neutralizes both soluble and transmembrane TNF, anti-TNFR1 (αTNFR1) and anti-TNFR2 (αTNFR2) antibodies, which both block the TNF-binding domain of the corresponding receptors, were incubated for 24 h. Following incubation, cell-free supernatants were assessed for IFNγ using ELISA. Data are from a representative experiment of 3 experiments performed. They are means ± SD of triplicates IFNγ ng/0.5 × 106 NK cells/mL. Asterisks indicate statistically significant differences in data from of NK vs. NK+mDCex+Isotype; NK vs. NK+mDCex+DNTNF; NK+mDCex+Isotype or NK+mDCex+DNTNF vs. NK+mDCex+αTNF, NK+mDCex+αTNFR1 or NK+mDCex+αTNFR2 (**, p = 0.005; ***, p < 0.001).
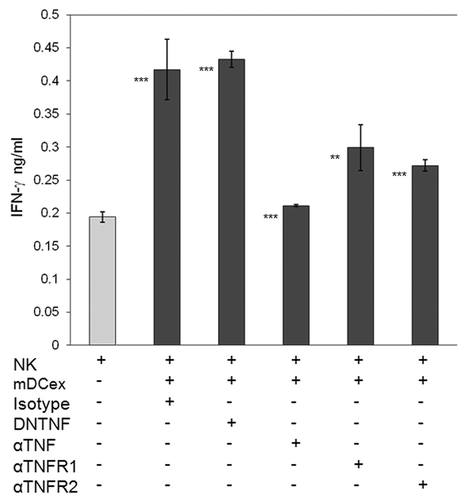
Figure 7. Transmembrane TNF, but not soluble TNF, mediates DCex-induced activation of NK cells. NK cells alone, and NK cells mixed with 20 μg DCex in the presence of isotype control antibodies (Isotype), dominant negative TNF (DNTNF), which selectively sequestrates soluble TNF, anti-TNF XT22 antibody (αTNF), which neutralizes both soluble and transmembrane TNF, anti-TNFR1 (αTNFR1) and anti-TNFR2 (αTNFR2) antibodies, which both block the TNF-binding domain of the corresponding receptors, were incubated for 24 h. Following incubation, cell-free supernatants were assessed for IFNγ using ELISA. Data are from a representative experiment of 3 experiments performed. They are means ± SD of triplicates IFNγ ng/0.5 × 106 NK cells/mL. Asterisks indicate statistically significant differences in data from of NK vs. NK+mDCex+Isotype; NK vs. NK+mDCex+DNTNF; NK+mDCex+Isotype or NK+mDCex+DNTNF vs. NK+mDCex+αTNF, NK+mDCex+αTNFR1 or NK+mDCex+αTNFR2 (**, p = 0.005; ***, p < 0.001).