Figures & data
Figure 1. In vivo analysis of oncogenic A-MuLV challenge. Newborn wild type (WT), Ifnar1+/−, Ifnar1−/−, Ifnb+/− and Ifnb−/− mice were injected intraperitoneally with a replication incompetent mouse pathogenic Abelson virus (A-MuLV) and monitored for disease development. (A, B) Kaplan-Meier plots of (A) WT, Ifnar1+/− and Ifnar1−/− littermates (n = 8, n = 15 and n = 9, respectively) and (B) WT, Ifnb+/− and Ifnb−/− littermates (n = 6, n = 16 and n = 10, respectively) infected with A-MuLV. Analyses of median survival demonstrate that leukemia proceeds significantly faster in Ifnar1−/− and Ifnb−/− mice than in WT control animals (A: Ifnar1−/− 41 d; wild type 72 d; p < 0.001; B: Ifnb −/− 51 d; WT 76 d; p < 0.05). (C) Representative FACS plots of lymph nodes infiltrated with leukemic cells. Percentages indicate the portion of CD19+B220+CD43+ cells, gated on living cells in the lymph nodes. (D) H&E-stained histologic sections show comparably dense tumor cell infiltrations in spleens and livers of WT, Ifnar1−/− and Ifnb−/− mice. Scale bars represent 100 μm in x10 and 50 μm in x20 magnification. (E) Spleen weights after sacrificing the diseased mice. Results are reported as means ± SEM.
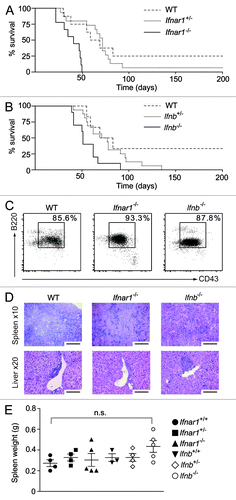
Figure 2. Characterization of B lymphoid transformation, proliferation and cell cycle-profiles in the absence of Type I IFN signaling. A-MuLV–induced colony formation of (A) WT, Ifnar1+/−, Ifnar1−/− and (B) WT, Ifnb+/−, Ifnb−/− bone marrow cells in methylcellulose. Summarized data obtained from A-MuLV–induced colony formation assays of (C) WT, Ifnar1+/−, Ifnar1−/− and (D) WT, Ifnb+/−, Ifnb−/− bone marrow cells showed non-significant (n.s.) differences. Data represent means ± SEM of four samples (one representative experiment out of three is shown). (E) [3H]Thymidine incorporation of bone marrow–derived WT (26.23 cpm ± 1.09; n = 18), Ifnar1−/− (27.93 cpm ± 0.86; n = 18) and Ifnb−/− (28.96 cpm ± 0.69; n = 18) A-MuLV–transformed cell lines. Data revealed no differences and summarize results of three independent experiments (means ± SEM). (F) Representative cell cycle profiles of A-MuLV transformed WT, Ifnar1−/− and Ifnb−/− bone marrow cell lines analyzed by FACS (sub-G1: WT: 6.5% ± 0.4; Ifnar1−/−: 4.5% ± 1.3; Ifnb−/−: 5.4% ± 0.6; G0/G1: WT: 42.4% ± 2.5; Ifnar1−/−: 31.4% ± 2.1; Ifnb−/−: 38.1% ± 3.9; S-phase: WT: 34.0% ± 1.8; Ifnar1−/−: 41.4% ± 2.7; Ifnb−/−: 36.3% ± 0.8; G2/M: WT: 17.1% ± 0.8; Ifnar1−/−: 23.0% ± 0.7; Ifnb−/−: 20.2% ± 3.7). Data revealed no differences and represent means ± SEM (G) CFSE dye dilution assay. Tumor cells were labeled with CFSE and cultured for up to 48 h without cytokines in standard culture medium. After 4, 8, 24 and 48 h, cells were harvested and the incremental loss of CFSE intensity corresponding to cell divisions was analyzed by flow cytometry.
![Figure 2. Characterization of B lymphoid transformation, proliferation and cell cycle-profiles in the absence of Type I IFN signaling. A-MuLV–induced colony formation of (A) WT, Ifnar1+/−, Ifnar1−/− and (B) WT, Ifnb+/−, Ifnb−/− bone marrow cells in methylcellulose. Summarized data obtained from A-MuLV–induced colony formation assays of (C) WT, Ifnar1+/−, Ifnar1−/− and (D) WT, Ifnb+/−, Ifnb−/− bone marrow cells showed non-significant (n.s.) differences. Data represent means ± SEM of four samples (one representative experiment out of three is shown). (E) [3H]Thymidine incorporation of bone marrow–derived WT (26.23 cpm ± 1.09; n = 18), Ifnar1−/− (27.93 cpm ± 0.86; n = 18) and Ifnb−/− (28.96 cpm ± 0.69; n = 18) A-MuLV–transformed cell lines. Data revealed no differences and summarize results of three independent experiments (means ± SEM). (F) Representative cell cycle profiles of A-MuLV transformed WT, Ifnar1−/− and Ifnb−/− bone marrow cell lines analyzed by FACS (sub-G1: WT: 6.5% ± 0.4; Ifnar1−/−: 4.5% ± 1.3; Ifnb−/−: 5.4% ± 0.6; G0/G1: WT: 42.4% ± 2.5; Ifnar1−/−: 31.4% ± 2.1; Ifnb−/−: 38.1% ± 3.9; S-phase: WT: 34.0% ± 1.8; Ifnar1−/−: 41.4% ± 2.7; Ifnb−/−: 36.3% ± 0.8; G2/M: WT: 17.1% ± 0.8; Ifnar1−/−: 23.0% ± 0.7; Ifnb−/−: 20.2% ± 3.7). Data revealed no differences and represent means ± SEM (G) CFSE dye dilution assay. Tumor cells were labeled with CFSE and cultured for up to 48 h without cytokines in standard culture medium. After 4, 8, 24 and 48 h, cells were harvested and the incremental loss of CFSE intensity corresponding to cell divisions was analyzed by flow cytometry.](/cms/asset/0cefc3ba-fd90-4c23-aad9-c81d46479558/koni_a_10921284_f0002.gif)
Figure 3. In vivo analysis of oncogenic A-MuLV challenge in Ifnar1f/f CD19-Cre animals. (A) Kaplan-Meier plot of newborn Ifnar1f/f CD19-Cre and Ifnar1f/f littermate mice infected via i.p. with A-MuLV (Ifnar1f/f CD19-Cre: n = 14, Ifnar1f/f: n = 13). (B) H&E-stained histologic sections of spleens and livers derived from diseased mice. Scale bars represent 100 μm in x10 and 50 μm in 20x magnification. (C) Percentages of tumor cells infiltrating bone marrow (BM), spleen (SP) and lymph nodes (LN) of Ifnar1f/f and Ifnar1f/f CD19-Cre mice.
Figure 4. Role of IFNAR1 in NK cell development. (A) Scheme of NCRI expression during NK cell development. (B) Frequency of BM NK precursor (NKP), immature (iNK) and mature NK (mNK) cells obtained from Ifnar1−/−, Ifnar1f/f Ncr1-iCre and WT mice. Bar graphs show the percentage of NKPs (DX5- NK1.1-, gated on Lin-CD122+), iNKs (DX5-NK1.1+, gated on Lin-CD122+) and mNKs (DX5+NK1.1+, gated on Lin-CD122+) in BM. (C) IFNAR1 expression on NKP, iNK and mNK subpopulations obtained from Ifnar1−/−, Ifnar1f/f Ncr1-iCre and Ifnar1f/f mice. MFI = mean fluorescence intensity. (D) Maturation status of splenic Ifnar1f/f, Ifnar1f/f Ncr1-iCre and Ifnar1−/− NK cells by flow cytometric analysis of CD27/CD11b expression. Gated on the entity of splenic NK1.1+ CD3- NK cells (set to 100%), bar graphs display the percentages of NK cells in four stages corresponding to progressive maturation: first CD27-CD11b-, second CD27+CD11b-, third CD27+CD11b+ and fourth CD27-CD11b+. (E) Bar graphs show the percentage of KLRG1+ cells (left panel) and DNAM-1+ cells (middle panel) in the NK1.1+CD3- NK cell compartment of the spleen. Bar graph on the right displays NKG2D expression level (mean fluorescence intensity, MFI) on splenic NK cells from Ifnar1−/−, Ifnar1f/f Ncr1-iCre and Ifnar1f/f mice. Pooled results from at least two independent experiments are presented as means ± SEM (*p < 0.05, **p < 0.01, ***p < 0.001).
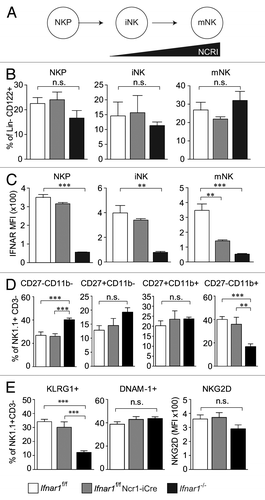
Figure 5. Characterization of Ifnar1−/− and Ifnb−/− NK cells. (A) A FACS-based degranulation assay measuring surface expression of the late endosomal marker CD107a was performed. Bar graph displays percentage of NK cells expressing CD107a under basal conditions (left), or after co-incubation with B16F10 and YAC-1 target cells (middle and right panel, respectively). (B, C) The in vitro cytotoxicity of WT, Ifnar1−/− and Ifnb−/− NK cells was measured in a flow cytometric-based assay using RMA-S and YAC-1 cells as targets. The specific lysis at different effector:target-cell ratios (10:1, 5:1, 1:1) differed significantly between the analyzed NK cells. Individual points represent means from triplicate wells ± SEM. One representative experiment out of three is depicted. (*p < 0.05). (D) Representative isolated lungs of WT, Ifnar1−/− and Ifnb−/− mice 14 d after intravenous injection of B16F10 melanoma cells. (E) The lung/body weight ratio was significantly higher in Ifnar1−/− and Ifnb−/− compared with WT mice after challenge with B16F10 tumor cells (p < 0.05).
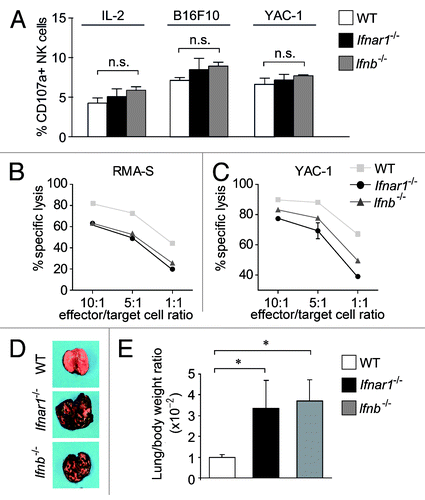
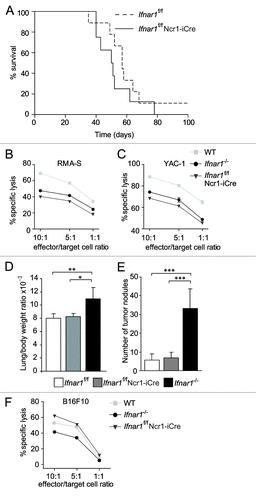
Figure 6. In vivo analysis of Ifnar1f/f Ncr1-iCre animals. (A) Kaplan-Meier plot of Ifnar1f/f Ncr1-iCre and Ifnar1f/f littermate mice infected via i.p. injection of A-MuLV. Log-rank test did not reveal a statistically significant difference in disease latency (p = 0.279; Ifnar1f/f Ncr1-iCre: n = 8, Ifnar1f/f: n = 9). (B, C) The in vitro cytotoxicity of WT, Ifnar1−/− and Ifnar1f/f Ncr1-iCre NK cells was measured in a flow cytometric-based assay using RMA-S and YAC-1 cells as targets. The specific lysis at different effector:target-cell ratios (10:1, 5:1, 1:1) differed significantly between the analyzed NK cells. Individual points represent means from triplicate wells ± SEM. One representative experiment out of three is depicted. (*p < 0.05). (D) Lung/body weight ratio and (E) number of tumor nodules on lungs after B16F10 melanoma cell injection into Ifnar1f/f Ncr1-iCre, Ifnar1f/f and Ifnar1−/− mice. (F) The in vitro cytotoxicity of Ifnar1f/f Ncr1-iCre, Ifnar1f/f and Ifnar1−/− NK cells was measured in a flow cytometric-based assay using B16F10 cells as targets. Individual points represent means from two preparations per group and triplicate wells ± SEM (*p < 0.05, **p < 0.01, ***p < 0.001).
