2,272
Views
37
CrossRef citations to date
0
Altmetric
Original Research

Murine leukemia virus envelope gp70 is a shared biomarker for the high-sensitivity quantification of murine tumor burden

, , , , , , , , , & show all
Article: e26889 | Received 26 Sep 2013, Accepted 20 Oct 2013, Published online: 22 Nov 2013

Figures & data

Figure 1. MuLV genomic structure and primer design for the detection of gp70-coding transcripts. The annealing sites of both of the primer pairs used in this study (gp70–1 and gp70–2) are indicated relative to sequence coding for the bioactive, H-2Ld-restricted peptide SPSYVYHQF (AH1, residues 423–431), which localizes near the 3′-end of the murine leukemia virus (MuLV) envelope (env) gp70-coding gene. These primer pairs, gp70–1 and gp70–2, result in a PCR product that is 110 and 103 base pairs in length, respectively.

Figure 1. MuLV genomic structure and primer design for the detection of gp70-coding transcripts. The annealing sites of both of the primer pairs used in this study (gp70–1 and gp70–2) are indicated relative to sequence coding for the bioactive, H-2Ld-restricted peptide SPSYVYHQF (AH1, residues 423–431), which localizes near the 3′-end of the murine leukemia virus (MuLV) envelope (env) gp70-coding gene. These primer pairs, gp70–1 and gp70–2, result in a PCR product that is 110 and 103 base pairs in length, respectively.

Table 1. gp70 expression levels in murine tumor cell lines

Figure 2. Relative expression levels of gp70-coding transcripts in mouse cancer cell lines and normal tissues. (A and B) Quantitative reverse-transcriptase PCR (qPCR) assays were performed using the gp70–1 primer pair (see also ) and results were combined to assess the relative amount of gp70-coding transcripts in a panel of common murine cancer cell lines (A) and normal mouse tissues (B). Gene expression was quantified by the 2−ΔΔCt method using cytochrome c1 (Cyc1) as housekeeping gene for normalization. The expression levels of gp70 in ALL302 cells was used as a reference for both neoplastic cells (A) and normal tissues (B). Relative gp70 mRNA levels are plotted on the Y-axis in logarithmic scale in panel A and in linear scale in panel B. Asterisks denote samples with undetectable gp70 expression.
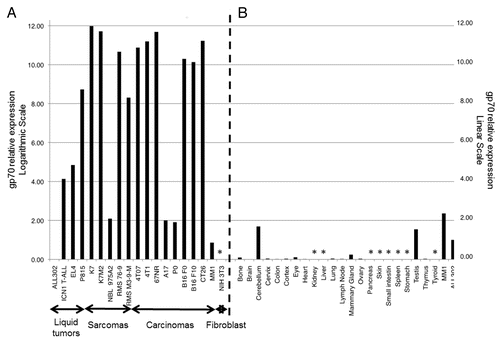
Figure 2. Relative expression levels of gp70-coding transcripts in mouse cancer cell lines and normal tissues. (A and B) Quantitative reverse-transcriptase PCR (qPCR) assays were performed using the gp70–1 primer pair (see also Figure 1) and results were combined to assess the relative amount of gp70-coding transcripts in a panel of common murine cancer cell lines (A) and normal mouse tissues (B). Gene expression was quantified by the 2−ΔΔCt method using cytochrome c1 (Cyc1) as housekeeping gene for normalization. The expression levels of gp70 in ALL302 cells was used as a reference for both neoplastic cells (A) and normal tissues (B). Relative gp70 mRNA levels are plotted on the Y-axis in logarithmic scale in panel A and in linear scale in panel B. Asterisks denote samples with undetectable gp70 expression.

Table 2. gp70 expression levels in normal mouse tissues

Figure 3. Sensitivity of the qPCR-based detection of gp70-coding transcripts from limiting amounts of cancer cells in total lung extracts. (A and B) Various numbers (100, 101, 10Citation2, 103, 104, 105, and 106) of murine colon carcinoma CT26 (A) or metastatic osteosarcoma K7M2 (B) cells were added to homogenized mouse lung tissue. Following reverse transcription, the gp70–1 primer pair (see also ) was used for quantitative reverse-transcriptase PCR (qPCR) assays. gp70 mRNA levels were then quantified by and the 2−ΔΔCt method using the cytochrome c1 (Cyc1) as housekeeping gene for normalization. Relative gp70 mRNA levels are plotted on the Y-axis in logarithmic scale. The coefficient of determination, R2, was > 0.97 in both cases.
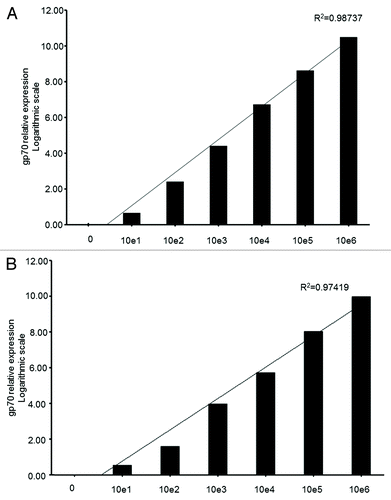
Figure 3. Sensitivity of the qPCR-based detection of gp70-coding transcripts from limiting amounts of cancer cells in total lung extracts. (A and B) Various numbers (100, 101, 10Citation2, 103, 104, 105, and 106) of murine colon carcinoma CT26 (A) or metastatic osteosarcoma K7M2 (B) cells were added to homogenized mouse lung tissue. Following reverse transcription, the gp70–1 primer pair (see also Figure 1) was used for quantitative reverse-transcriptase PCR (qPCR) assays. gp70 mRNA levels were then quantified by and the 2−ΔΔCt method using the cytochrome c1 (Cyc1) as housekeeping gene for normalization. Relative gp70 mRNA levels are plotted on the Y-axis in logarithmic scale. The coefficient of determination, R2, was > 0.97 in both cases.

Figure 4. Comparison of gp70-specific qPCR, bioluminescence and histological methods to detect osteosarcoma cells in vivo. (A–C) BALB/c mice (n = 3 per group) were injected with 106 firefly luciferase (Luc2)-expressing K7 or K7M2 cells in the proximal tibia. (A) Relative expression levels of gp70-coding transcripts as detected by quantitative reverse-transcriptase PCR (qPCR) in the whole lung tissues of individual tumor-bearing animals 28 d after the inoculation of cancer cells. (B) Whole mouse bioluminescence imaging (BLI) of the same tumor-bearing mice indicated above, immediately prior to lung harvesting (28 d after cancer cell inoculation). Red circles represent the regions of interest (ROIs) that were employed to quantify BLI signal intensity. (C) Histological examination of tissue sections from the lungs harvested from the same tumor-bearing animals analyzed in panels (A and B). Visible lung tumor nodules were scored in 15 consecutive sections of each individual lung, with “−” means no tumor detected in any of the 15 slides, and the number of “+” represent the maximum number of tumor nodules seen in a single slide.
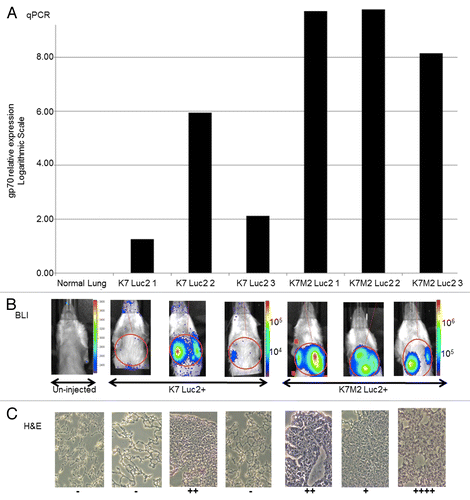
Figure 4. Comparison of gp70-specific qPCR, bioluminescence and histological methods to detect osteosarcoma cells in vivo. (A–C) BALB/c mice (n = 3 per group) were injected with 106 firefly luciferase (Luc2)-expressing K7 or K7M2 cells in the proximal tibia. (A) Relative expression levels of gp70-coding transcripts as detected by quantitative reverse-transcriptase PCR (qPCR) in the whole lung tissues of individual tumor-bearing animals 28 d after the inoculation of cancer cells. (B) Whole mouse bioluminescence imaging (BLI) of the same tumor-bearing mice indicated above, immediately prior to lung harvesting (28 d after cancer cell inoculation). Red circles represent the regions of interest (ROIs) that were employed to quantify BLI signal intensity. (C) Histological examination of tissue sections from the lungs harvested from the same tumor-bearing animals analyzed in panels (A and B). Visible lung tumor nodules were scored in 15 consecutive sections of each individual lung, with “−” means no tumor detected in any of the 15 slides, and the number of “+” represent the maximum number of tumor nodules seen in a single slide.

Figure 5. The qPCR-based detection of gp70-coding transcripts is more sensitive than flow cytometry to identify T lymphoblasts in the peripheral blood. (A–D) C57BL/6 mice (n = 3 per group) received 5 × 10², 5 × 10⁴, or 5 × 10⁵ green fluorescence protein (GFP)-expressing ICN1 acute lymphoblastic leukemia (ALL) cells and their peripheral blood was collected for subsequent analyses at various time points. (A) Kaplan–Meier survival curves of C57BL/6 mice receiving the indicated number of ALL cells. (B) Map of gp70-coding sequence, demonstrating the annealing sites for the gp70–3 and gp70–1 primer sets employed for the nested PCR-based detection of gp70-coding transcripts in the peripheral blood of tumor-inoculated mice. (C) Detection of gp70-coding transcripts by nested PCR in mice inoculated with the indicated number of ALL cells i.v. 4 d earlier. (D) Serial monitoring of mice receiving the indicated number of ALL cells for the appearance of a GFP+CD8+ cell population (corresponding to ALL cells) in the peripheral blood. Pre-inoculation ALL cells (tumor only) were analyzed for comparative purposes.
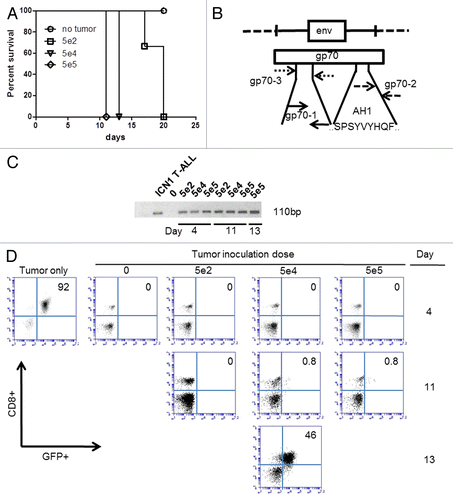
Figure 5. The qPCR-based detection of gp70-coding transcripts is more sensitive than flow cytometry to identify T lymphoblasts in the peripheral blood. (A–D) C57BL/6 mice (n = 3 per group) received 5 × 10², 5 × 10⁴, or 5 × 10⁵ green fluorescence protein (GFP)-expressing ICN1 acute lymphoblastic leukemia (ALL) cells and their peripheral blood was collected for subsequent analyses at various time points. (A) Kaplan–Meier survival curves of C57BL/6 mice receiving the indicated number of ALL cells. (B) Map of gp70-coding sequence, demonstrating the annealing sites for the gp70–3 and gp70–1 primer sets employed for the nested PCR-based detection of gp70-coding transcripts in the peripheral blood of tumor-inoculated mice. (C) Detection of gp70-coding transcripts by nested PCR in mice inoculated with the indicated number of ALL cells i.v. 4 d earlier. (D) Serial monitoring of mice receiving the indicated number of ALL cells for the appearance of a GFP+CD8+ cell population (corresponding to ALL cells) in the peripheral blood. Pre-inoculation ALL cells (tumor only) were analyzed for comparative purposes.
Supplemental material

Additional material

Download Zip (205.4 KB)