742
Views
3
CrossRef citations to date
0
Altmetric
Original Research

Helper cell-independent antitumor activity of potent CD8+ T cell epitope peptide vaccines is dependent upon CD40L

, , , , , , , , & show all
Article: e27009 | Received 04 Sep 2013, Accepted 30 Oct 2013, Published online: 05 Dec 2013

Figures & data

Figure 1. Strong CD8+ T-cell peptide vaccines induce helper-independent, CD8+ T-cell antitumor responses. (A–C) BALB/c mice (n = 5 to 6) were immunized subcutaneously with 100 μg of peptides AH1 or AH1-A5 emulsified in incomplete Freund’s adjuvant (IFA). Control mice were administered IFA alone. Ten days later the animals were challenged with 5 × 10⁵ CT26 tumor cells implanted s.c. (A) Tumor growth (left panel) and animal survival (right panel) was monitored twice per week. (B) Splenocytes were harvested 10 d after immunization and stimulated ex vivo for 2 d with AH1 or AH1-A5 and the number of interferon-γ (IFNγ) spot-forming cells (SFC) was measured by ELISPOT. A no antigen (Ag) control was used for comparison. (C) The expression of IFNγ by CD4+ and CD8+ T cell subsets was analyzed by immunostaining and cytofluorometric analysis of cells cultured with or without AH1-A5. Left, dot plots showing the results of the analysis of a representative mouse relative to a no peptide (pep) control. Right, bar graphs showing the mean ± SEM (n = 5) of a single experiment. (D–F) C57BL/6 mice (n = 6) were immunized s.c. with 100 μg of peptides TRP2180–188 or OVA257–264 in IFA or IFA alone and 10 d later they were challenged s.c. with 105 B16-OVA tumor cells. (D) Tumor growth (left panel) and animal survival (right panel) was monitored twice per week. (E) Splenocytes were harvested from immunized animals 10 d later and IFNγ production was measured by ELISPOT. (F) Cytofluorometric analysis and percent IFNγ expressing cells in CD4+ and CD8+ T cell subsets. Results are representative of 2–3 independent experiments. Statistical analyses of immune responses were performed by nonparametric Kruskal–Wallis and Mann–Whitney U tests. Survival curves were plotted according to the Kaplan–Meier method and the log-rank test was used to measure statistical significance. In all cases, *P < 0.05 was considered statistically significant.
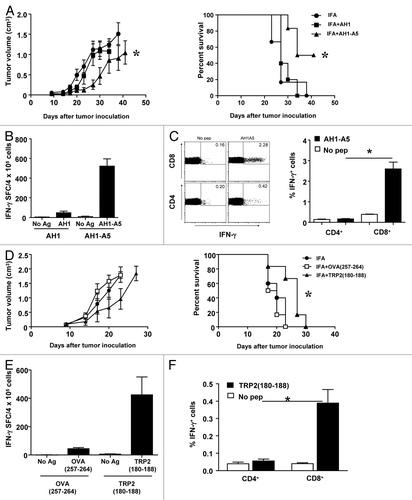
Figure 1. Strong CD8+ T-cell peptide vaccines induce helper-independent, CD8+ T-cell antitumor responses. (A–C) BALB/c mice (n = 5 to 6) were immunized subcutaneously with 100 μg of peptides AH1 or AH1-A5 emulsified in incomplete Freund’s adjuvant (IFA). Control mice were administered IFA alone. Ten days later the animals were challenged with 5 × 10⁵ CT26 tumor cells implanted s.c. (A) Tumor growth (left panel) and animal survival (right panel) was monitored twice per week. (B) Splenocytes were harvested 10 d after immunization and stimulated ex vivo for 2 d with AH1 or AH1-A5 and the number of interferon-γ (IFNγ) spot-forming cells (SFC) was measured by ELISPOT. A no antigen (Ag) control was used for comparison. (C) The expression of IFNγ by CD4+ and CD8+ T cell subsets was analyzed by immunostaining and cytofluorometric analysis of cells cultured with or without AH1-A5. Left, dot plots showing the results of the analysis of a representative mouse relative to a no peptide (pep) control. Right, bar graphs showing the mean ± SEM (n = 5) of a single experiment. (D–F) C57BL/6 mice (n = 6) were immunized s.c. with 100 μg of peptides TRP2180–188 or OVA257–264 in IFA or IFA alone and 10 d later they were challenged s.c. with 105 B16-OVA tumor cells. (D) Tumor growth (left panel) and animal survival (right panel) was monitored twice per week. (E) Splenocytes were harvested from immunized animals 10 d later and IFNγ production was measured by ELISPOT. (F) Cytofluorometric analysis and percent IFNγ expressing cells in CD4+ and CD8+ T cell subsets. Results are representative of 2–3 independent experiments. Statistical analyses of immune responses were performed by nonparametric Kruskal–Wallis and Mann–Whitney U tests. Survival curves were plotted according to the Kaplan–Meier method and the log-rank test was used to measure statistical significance. In all cases, *P < 0.05 was considered statistically significant.

Figure 2. Antitumor CD8+ T-cell responses induced by potent peptide vaccines are dependent on CD40L. (A) BALB/c or C57BL/6 mice (n = 3/group) were immunized subcutaneously with 100 μg of AH1-A5 or TRP2180–188 peptide, respectively. In both cases, mice also received 0.25 mg anti-CD40L or isotype control antibodies by i.p. injection at days −2, 0, and +2 relative to the day of immunization. Ten days later, splenocytes were stimulated with the corresponding peptide and T-cell responses were measured using an IFNγ ELISPOT assay. Results correspond to the difference between antigen-stimulated and unstimulated cells in each group. Data are representative of at least 2 independent experiments. Statistical analyses were performed by Mann–Whitney U tests; ** P < 0.01, ***; P < 0.0001. (B) Mice (n = 6) vaccinated as above were challenged with CT26 or B16-OVA tumor cells 10 d after vaccination. Animal survival was monitored twice per week. Survival curves were plotted according to the Kaplan–Meier method and the log-rank test was used to measure statistical significance; * P < 0.05.
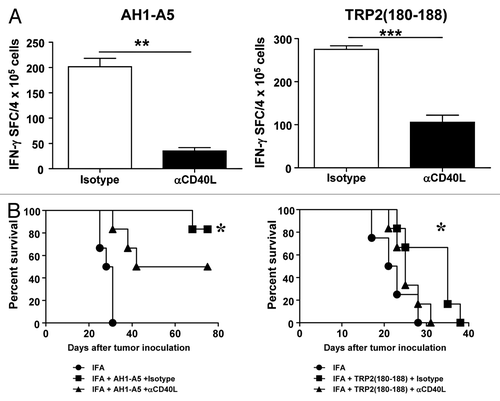
Figure 2. Antitumor CD8+ T-cell responses induced by potent peptide vaccines are dependent on CD40L. (A) BALB/c or C57BL/6 mice (n = 3/group) were immunized subcutaneously with 100 μg of AH1-A5 or TRP2180–188 peptide, respectively. In both cases, mice also received 0.25 mg anti-CD40L or isotype control antibodies by i.p. injection at days −2, 0, and +2 relative to the day of immunization. Ten days later, splenocytes were stimulated with the corresponding peptide and T-cell responses were measured using an IFNγ ELISPOT assay. Results correspond to the difference between antigen-stimulated and unstimulated cells in each group. Data are representative of at least 2 independent experiments. Statistical analyses were performed by Mann–Whitney U tests; ** P < 0.01, ***; P < 0.0001. (B) Mice (n = 6) vaccinated as above were challenged with CT26 or B16-OVA tumor cells 10 d after vaccination. Animal survival was monitored twice per week. Survival curves were plotted according to the Kaplan–Meier method and the log-rank test was used to measure statistical significance; * P < 0.05.

Figure 3. Potent peptide vaccines induce the upregulation of CD40L on CD8+ T cells. (A and B) BALB/c (A) or C57BL/6 (B) mice (n = 3/group) were immunized with 100 μg of AH1-A5 or TRP2180–188 peptide, respectively. In both cases, after 10 d splenocytes derived from treated mice were cultured with or without the corresponding peptide and 5 h later IFNγ production and expression of CD40L was analyzed on CD8+ or CD4+ T cells by flow cytometry. Left, dot plots showing the results of the analysis of a representative mouse relative to a no peptide (pep) control. Right, bar graphs showing the mean ± SEM (n = 3) of a single experiment. Results are representative of 3 independent experiments. (C) Cytofluorometric analysis of expression of IFNγ and CD40L in splenocytes derived from AH1-A5-immunized mice and stimulated in vitro with peptide AH1 for 5 h. (D and E) CD8+ T cell lines specific for AH1 or AH1-A5 were stimulated for 5 h with peptide epitopes and expression IFNγ (D) or IFNγ and CD40L (E) were analyzed by immunofluorescence staining and flow cytometry. Statistical analyses were performed by Mann–Whitney U tests; * P < 0.05; ** P < 0.01.
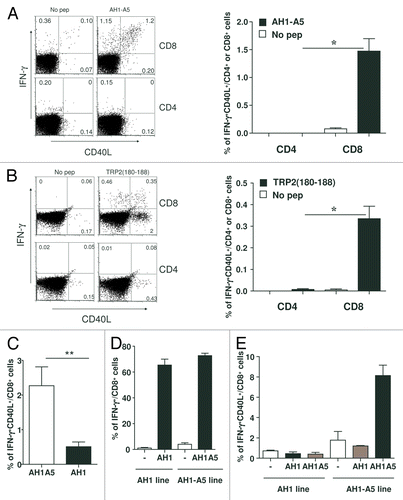
Figure 3. Potent peptide vaccines induce the upregulation of CD40L on CD8+ T cells. (A and B) BALB/c (A) or C57BL/6 (B) mice (n = 3/group) were immunized with 100 μg of AH1-A5 or TRP2180–188 peptide, respectively. In both cases, after 10 d splenocytes derived from treated mice were cultured with or without the corresponding peptide and 5 h later IFNγ production and expression of CD40L was analyzed on CD8+ or CD4+ T cells by flow cytometry. Left, dot plots showing the results of the analysis of a representative mouse relative to a no peptide (pep) control. Right, bar graphs showing the mean ± SEM (n = 3) of a single experiment. Results are representative of 3 independent experiments. (C) Cytofluorometric analysis of expression of IFNγ and CD40L in splenocytes derived from AH1-A5-immunized mice and stimulated in vitro with peptide AH1 for 5 h. (D and E) CD8+ T cell lines specific for AH1 or AH1-A5 were stimulated for 5 h with peptide epitopes and expression IFNγ (D) or IFNγ and CD40L (E) were analyzed by immunofluorescence staining and flow cytometry. Statistical analyses were performed by Mann–Whitney U tests; * P < 0.05; ** P < 0.01.

Figure 4. Peptide-induced CD40L expression leads to dendritic cell maturation. (A) Splenocytes from AH1-A5 or TRP2180–188-immunized mice (n = 3) were stimulated for 24 h with the corresponding peptide and CD86 expression was measured in CD11c+, I-Ad+ or I-Ab+ dendritic cells (DCs) by immunofluorescence staining and flow cytometry. (B) Splenocytes from peptide-immunized mice (n =3 ) were stimulated as above in the presence of anti-CD40L or isotype control antibodies and CD86 expression on DC was analyzed. Data are representative of 3 independent experiments. Statistical analyses were performed by Mann–Whitney U tests; * P < 0.05, **; P < 0.01)
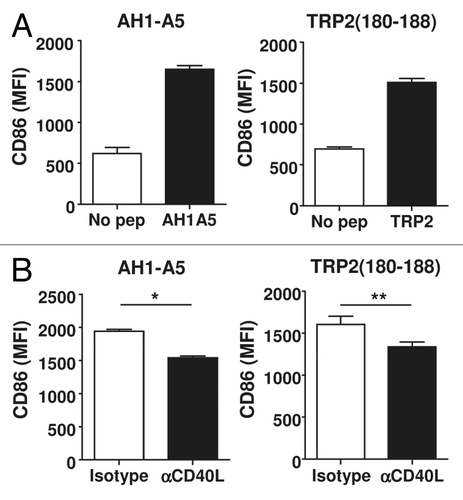
Figure 4. Peptide-induced CD40L expression leads to dendritic cell maturation. (A) Splenocytes from AH1-A5 or TRP2180–188-immunized mice (n = 3) were stimulated for 24 h with the corresponding peptide and CD86 expression was measured in CD11c+, I-Ad+ or I-Ab+ dendritic cells (DCs) by immunofluorescence staining and flow cytometry. (B) Splenocytes from peptide-immunized mice (n =3 ) were stimulated as above in the presence of anti-CD40L or isotype control antibodies and CD86 expression on DC was analyzed. Data are representative of 3 independent experiments. Statistical analyses were performed by Mann–Whitney U tests; * P < 0.05, **; P < 0.01)

Figure 5. CD40L induced by peptide stimulation amplifies CD8+ T-cell responses. (A and B) Splenocytes from AH1-A5 (A) or TRP2180–188 (B) -immunized mice (n = 3/group) were stimulated with their corresponding peptide in the presence of anti-CD40L or isotype control antibodies and IFNγ production was measured 48 h later by ELISA. (C) Flow cytometry purified CD8+ T cells from AH1-A5-immunized mice were stimulated using mature antigen presenting cells pulsed with AH1-A5 peptide in the presence of anti-CD40L blocking or isotype control antibodies and IFNγ production was measured 48 h later by ELISA. (D) CD8+ T cells obtained from an AH1-A5-specific T cell line were stimulated in vitro with plate-bound anti-CD3 antibody with or without recombinant Fc-CD40 or soluble, trimeric CD40L molecules, and IFNγ production was measured as above. Data are representative of 2 independent experiments. Statistical analyses were performed by Mann–Whitney U tests; * P < 0.05.
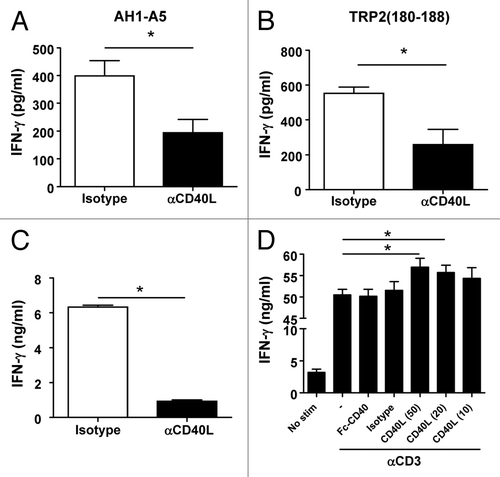
Figure 5. CD40L induced by peptide stimulation amplifies CD8+ T-cell responses. (A and B) Splenocytes from AH1-A5 (A) or TRP2180–188 (B) -immunized mice (n = 3/group) were stimulated with their corresponding peptide in the presence of anti-CD40L or isotype control antibodies and IFNγ production was measured 48 h later by ELISA. (C) Flow cytometry purified CD8+ T cells from AH1-A5-immunized mice were stimulated using mature antigen presenting cells pulsed with AH1-A5 peptide in the presence of anti-CD40L blocking or isotype control antibodies and IFNγ production was measured 48 h later by ELISA. (D) CD8+ T cells obtained from an AH1-A5-specific T cell line were stimulated in vitro with plate-bound anti-CD3 antibody with or without recombinant Fc-CD40 or soluble, trimeric CD40L molecules, and IFNγ production was measured as above. Data are representative of 2 independent experiments. Statistical analyses were performed by Mann–Whitney U tests; * P < 0.05.

Figure 6. Strong CD8+ T-cell peptide epitopes behave as helper peptides in a CD40L-dependent manner. (A–D) C57BL/6 mice (A and B) or CB6F1-hybrid mice (C and D) (n = 4/group) were immunized with 100 μg of OVA257–264 peptide epitope alone or in combination with (A and B) TRP2180–188 or (C and D) AH1-A5 peptide. In some experiments (B and D) mice receiving peptide combinations also received i.p. injection with 0.25 mg anti-CD40L blocking or isotype control antibodies at day −2, 0, and +2, with d 0 corresponding to the day of immunization. In all cases, 10 d later harvested splenocytes were stimulated with OVA257–264in vitro and T-cell responses were measured using an IFNγ ELISPOT assay. Results correspond to the difference between antigen-stimulated and unstimulated cells in each group. Data are representative of 2 independent experiments. Statistical analyses were performed by Mann–Whitney U tests; * P < 0.05; ** P < 0.01; *** P < 0.0001.
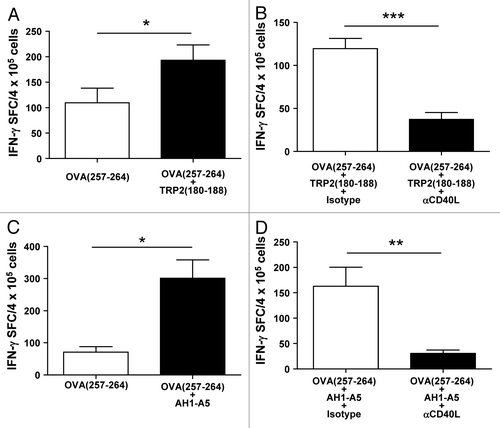
Figure 6. Strong CD8+ T-cell peptide epitopes behave as helper peptides in a CD40L-dependent manner. (A–D) C57BL/6 mice (A and B) or CB6F1-hybrid mice (C and D) (n = 4/group) were immunized with 100 μg of OVA257–264 peptide epitope alone or in combination with (A and B) TRP2180–188 or (C and D) AH1-A5 peptide. In some experiments (B and D) mice receiving peptide combinations also received i.p. injection with 0.25 mg anti-CD40L blocking or isotype control antibodies at day −2, 0, and +2, with d 0 corresponding to the day of immunization. In all cases, 10 d later harvested splenocytes were stimulated with OVA257–264in vitro and T-cell responses were measured using an IFNγ ELISPOT assay. Results correspond to the difference between antigen-stimulated and unstimulated cells in each group. Data are representative of 2 independent experiments. Statistical analyses were performed by Mann–Whitney U tests; * P < 0.05; ** P < 0.01; *** P < 0.0001.

Figure 7. Potent peptides used in clinical trials induce CD40L-expressing CD8+ T cells in mice. (A and B) HHD mice (n = 3/group) transgenic for HLA-A2 were immunized with HLA-A2-restricted peptide epitope Melan A/MART-126–35 (EAA) or with its highly immunogenic mutated version containing a leucine at position 27 (ELA) (A), or with epitope 369–377 from tyrosinase (Tyr369) (B). Ten days later splenocytes from immunized mice were stimulated with or without the corresponding peptide and T-cell responses were measured using an IFNγ ELISPOT assay. (C–D) After 5 h of peptide stimulation CD8+ and CD4+ T cells were analyzed by immunofluorescence staining and flow cytometry for expression of CD40L and IFNγ. Data are representative of 2 independent experiments.
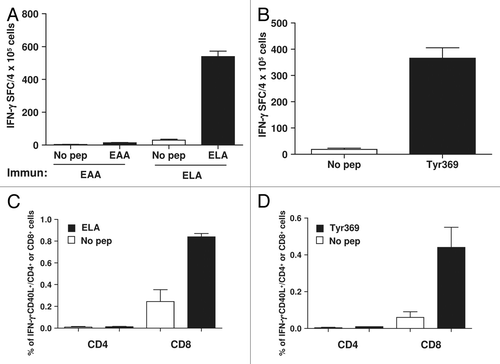
Figure 7. Potent peptides used in clinical trials induce CD40L-expressing CD8+ T cells in mice. (A and B) HHD mice (n = 3/group) transgenic for HLA-A2 were immunized with HLA-A2-restricted peptide epitope Melan A/MART-126–35 (EAA) or with its highly immunogenic mutated version containing a leucine at position 27 (ELA) (A), or with epitope 369–377 from tyrosinase (Tyr369) (B). Ten days later splenocytes from immunized mice were stimulated with or without the corresponding peptide and T-cell responses were measured using an IFNγ ELISPOT assay. (C–D) After 5 h of peptide stimulation CD8+ and CD4+ T cells were analyzed by immunofluorescence staining and flow cytometry for expression of CD40L and IFNγ. Data are representative of 2 independent experiments.
Supplemental material

Additional material

Download Zip (124.9 KB)