695
Views
4
CrossRef citations to date
0
Altmetric
Author's View

Immunotherapeutic implications of the immunophenotype of pediatric brain tumors

, &
Article: e27256 | Received 15 Nov 2013, Accepted 18 Nov 2013, Published online: 01 Jan 2014

Figures & data

Figure 1. Distinct profiles of myeloid cells and T lymphocytes are found in pediatric brain tumors. (A and B) Multicolor flow cytometry was used to measure the extent and functional phenotype of myeloid cells infiltrating the non-malignant brain (NT), obtained from epilepsy resections, as well as pilocytic astrocytomas (PAs), ependymomas (EPNs), glioblastomas (GBMs) and medulloblastomas (MEDs), obtained from the surgical resection of primary neoplasms in pediatric patients. The relative amount of tumor-infiltrating CD45+CD11b+ myeloid cells (A), CD3+CD8+ cytotoxic T cells (B) and CD3+CD4+ helper T cells (B) is illustrated. Black columns indicate values that were significantly different as compared with NT samples (P < 0.05). Pie charts represent the proportion of tumor-infiltrating myeloid cells (A) and T cells (B) that express the indicated immunophenotypic markers of activation (in blue) or immature state/immunosuppression (in red).
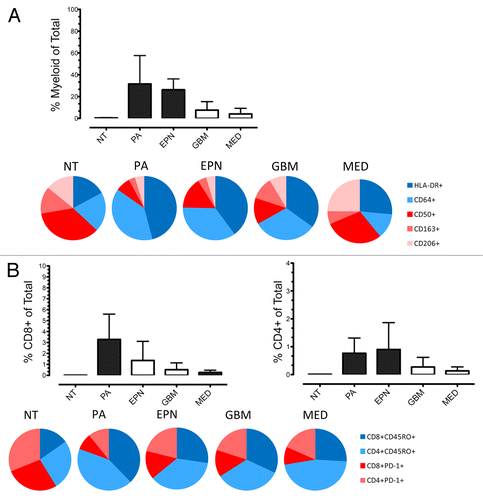
Figure 1. Distinct profiles of myeloid cells and T lymphocytes are found in pediatric brain tumors. (A and B) Multicolor flow cytometry was used to measure the extent and functional phenotype of myeloid cells infiltrating the non-malignant brain (NT), obtained from epilepsy resections, as well as pilocytic astrocytomas (PAs), ependymomas (EPNs), glioblastomas (GBMs) and medulloblastomas (MEDs), obtained from the surgical resection of primary neoplasms in pediatric patients. The relative amount of tumor-infiltrating CD45+CD11b+ myeloid cells (A), CD3+CD8+ cytotoxic T cells (B) and CD3+CD4+ helper T cells (B) is illustrated. Black columns indicate values that were significantly different as compared with NT samples (P < 0.05). Pie charts represent the proportion of tumor-infiltrating myeloid cells (A) and T cells (B) that express the indicated immunophenotypic markers of activation (in blue) or immature state/immunosuppression (in red).