2,103
Views
14
CrossRef citations to date
0
Altmetric
RESEARCH PAPER

Epithelial-mesenchymal co-culture model for studying alveolar morphogenesis

, , , &
Pages 340-349 | Received 20 Sep 2013, Accepted 10 May 2014, Published online: 31 Oct 2014

Figures & data

Figure 1. Formation of 3-dimensional structures in epithelial-mesenchymal co-cultures. (A) Diagram of epithelial-mesenchymal co-culture system. (B–E). Images of A549 epithelia and primary mesenchyme cultured alone and imaged by varel optics (B and D) or dark field microscopy (C and E). (F) Dark field image of epithelial-mesenchymal co-culture following three days of co-culture. Bright structures are peaks that rise from the culture dish. (G) Phase contrast image of a 3-dimensional peak with adjacent monolayer of cells. (H and I) Dark field images of co-cultures using newborn lung fibroblasts (H) or adult lung fibroblasts (I). (J–L) Fewer 3-dimensional structures were observed when using subconfluent cultures.
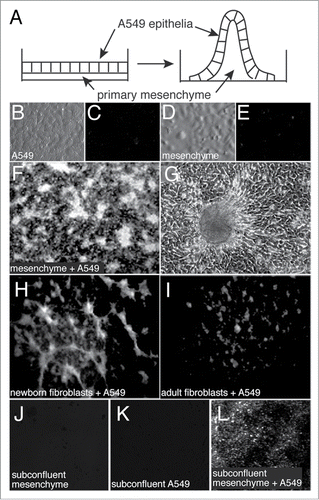
Figure 1. Formation of 3-dimensional structures in epithelial-mesenchymal co-cultures. (A) Diagram of epithelial-mesenchymal co-culture system. (B–E). Images of A549 epithelia and primary mesenchyme cultured alone and imaged by varel optics (B and D) or dark field microscopy (C and E). (F) Dark field image of epithelial-mesenchymal co-culture following three days of co-culture. Bright structures are peaks that rise from the culture dish. (G) Phase contrast image of a 3-dimensional peak with adjacent monolayer of cells. (H and I) Dark field images of co-cultures using newborn lung fibroblasts (H) or adult lung fibroblasts (I). (J–L) Fewer 3-dimensional structures were observed when using subconfluent cultures.

Figure 2. Orientation of epithelial and mesenchymal cells within 3-dimensional peaks. (A–C) Confocal sections through co-cultures in which mesenchyme was labeled with DiI prior to addition of epithelial cells. Nuclei were labeled with SYTO 13. (D–F) Confocal images of co-cultures immunostained for cytokeratin 18 expression. Nuclei were labeled with DAPI. 3-dimensional peaks have cores of mesenchyme covered by epithelial cells. (G and H) Confocal sections through newborn mouse lungs showing developing alveolar septa are comprised of mesenchymal cell cores (α-SMA-positive cells, red) covered by epithelia (E-cad, green). Nuclei labeled with TO-PRO-3. (I and J) Adding mesenchymal cells to confluent monolayers of A549 epithelia (reversing the order) produced ridges containing elongated mesenchymal cells, but not the tall peaks and numerous ridges seen in A-F. (I) Darkfield image. (J) Confocal image of immunostained co-culture. (E-cadherin, green; α-SMA, red; nuclei labeled with Draq5).
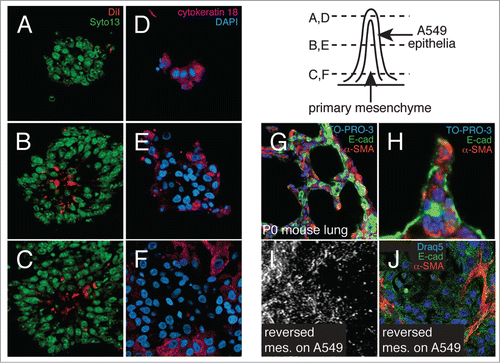
Figure 2. Orientation of epithelial and mesenchymal cells within 3-dimensional peaks. (A–C) Confocal sections through co-cultures in which mesenchyme was labeled with DiI prior to addition of epithelial cells. Nuclei were labeled with SYTO 13. (D–F) Confocal images of co-cultures immunostained for cytokeratin 18 expression. Nuclei were labeled with DAPI. 3-dimensional peaks have cores of mesenchyme covered by epithelial cells. (G and H) Confocal sections through newborn mouse lungs showing developing alveolar septa are comprised of mesenchymal cell cores (α-SMA-positive cells, red) covered by epithelia (E-cad, green). Nuclei labeled with TO-PRO-3. (I and J) Adding mesenchymal cells to confluent monolayers of A549 epithelia (reversing the order) produced ridges containing elongated mesenchymal cells, but not the tall peaks and numerous ridges seen in A-F. (I) Darkfield image. (J) Confocal image of immunostained co-culture. (E-cadherin, green; α-SMA, red; nuclei labeled with Draq5).

Figure 3. 3-dimensional peak formation does not require cell proliferation or apoptosis. (A–D) Serum deprivation for 48 h slows epithelial proliferation (B), but does not alter 3-dimensional peak height (C) or peak number (D) (n = 6). (E). Co-culturing A549 epithelia with mesenchymal cells increases apoptosis as measured by caspase 3/7 activity. Apoptosis was measured both in cells cultured alone (white and gray bars) and in co-cultures (black bar) (* P < 0.05; n = 6). (F and G). Apoptosis inhibitors Z-VAD-FMK and NS3694 reduce caspase 3/7 activity (F; * P < 0.05 compared with control, # P < 0.05 compared with camptothecin alone, n = 12), but have no effect on 3-dimensional peak number (G; n = 20).
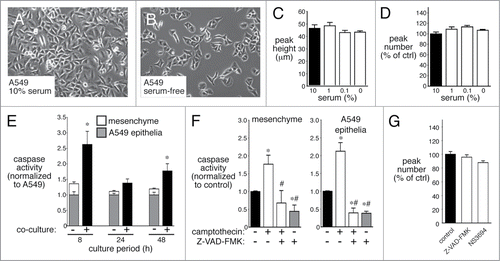
Figure 3. 3-dimensional peak formation does not require cell proliferation or apoptosis. (A–D) Serum deprivation for 48 h slows epithelial proliferation (B), but does not alter 3-dimensional peak height (C) or peak number (D) (n = 6). (E). Co-culturing A549 epithelia with mesenchymal cells increases apoptosis as measured by caspase 3/7 activity. Apoptosis was measured both in cells cultured alone (white and gray bars) and in co-cultures (black bar) (* P < 0.05; n = 6). (F and G). Apoptosis inhibitors Z-VAD-FMK and NS3694 reduce caspase 3/7 activity (F; * P < 0.05 compared with control, # P < 0.05 compared with camptothecin alone, n = 12), but have no effect on 3-dimensional peak number (G; n = 20).

Figure 4. Epithelial cells appear to repel mesenchymal cells in co-culture. (A and B) DiI labeled mesenchymal cells begin to form 3-dimensional peaks and ridges following 18 h of co-culture. (C–E) DiI labeled mesenchyme was co-cultured with a reduced number of epithelia, allowing islands of epithelia to form within the co-cultures (dotted lines). Mesenchymal cells were excluded from these islands (C). (F–H) Epithelial cells stimulate mesenchymal cell elongation. Mesenchymal cells were cultured with reduced numbers of cells as in (C and D). Actin cytoskeleton was visualized using Alexa594-phalloidin. Nuclei were labeled with DAPI. Arrows indicate areas of apparent membrane retraction. (I–K) Orientation of alveolar Type II cells (E-cad positive, green) with mesenchymal cells (α-SMA positive, red) in newborn mouse lungs. Mesenchymal cell membrane processes extend between Type II cells, suggesting possible epithelial-mesenchymal cell repulsion.
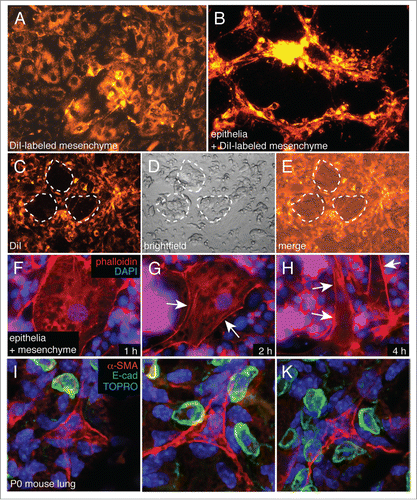
Figure 4. Epithelial cells appear to repel mesenchymal cells in co-culture. (A and B) DiI labeled mesenchymal cells begin to form 3-dimensional peaks and ridges following 18 h of co-culture. (C–E) DiI labeled mesenchyme was co-cultured with a reduced number of epithelia, allowing islands of epithelia to form within the co-cultures (dotted lines). Mesenchymal cells were excluded from these islands (C). (F–H) Epithelial cells stimulate mesenchymal cell elongation. Mesenchymal cells were cultured with reduced numbers of cells as in (C and D). Actin cytoskeleton was visualized using Alexa594-phalloidin. Nuclei were labeled with DAPI. Arrows indicate areas of apparent membrane retraction. (I–K) Orientation of alveolar Type II cells (E-cad positive, green) with mesenchymal cells (α-SMA positive, red) in newborn mouse lungs. Mesenchymal cell membrane processes extend between Type II cells, suggesting possible epithelial-mesenchymal cell repulsion.

Figure 5. LPS inhibits 3-dimensional peak formation and mesenchymal cell migration. (A–D) Dark field (A and B) and phase contrast (C and D) images of control and LPS-treated epithelial-mesenchymal co-cultures. LPS treatment resulted in fewer 3-D peaks (E; * P < 0.05, n = 6) that also appeared smaller in size (B and D). (F–K) Confocal images show that DiI-labeled mesenchymal cells (red) did not extend as high into 3-D peaks following LPS treatment (I–K) compared with controls (F–H). (L) Reduced peak height in LPS-treated co-cultures (* P < 0.05, n = 30). (M and N) Live cell imaging of DiI-labeled mesenchymal cells within co-cultures measured reduced cell migration with LPS treatment. Positional traces of individual cells that demonstrate displacement from the starting position within a culture are shown in (M). Average velocity is reduced by LPS treatment (N; * P < 0.05, n = 14).
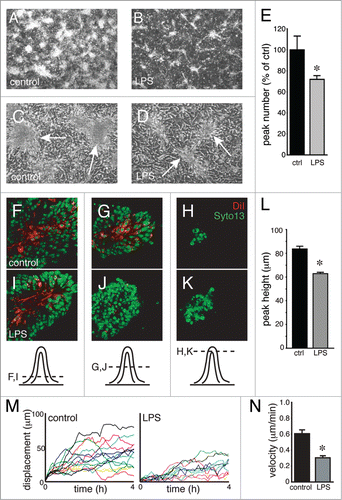
Figure 5. LPS inhibits 3-dimensional peak formation and mesenchymal cell migration. (A–D) Dark field (A and B) and phase contrast (C and D) images of control and LPS-treated epithelial-mesenchymal co-cultures. LPS treatment resulted in fewer 3-D peaks (E; * P < 0.05, n = 6) that also appeared smaller in size (B and D). (F–K) Confocal images show that DiI-labeled mesenchymal cells (red) did not extend as high into 3-D peaks following LPS treatment (I–K) compared with controls (F–H). (L) Reduced peak height in LPS-treated co-cultures (* P < 0.05, n = 30). (M and N) Live cell imaging of DiI-labeled mesenchymal cells within co-cultures measured reduced cell migration with LPS treatment. Positional traces of individual cells that demonstrate displacement from the starting position within a culture are shown in (M). Average velocity is reduced by LPS treatment (N; * P < 0.05, n = 14).

Reprints and Corporate Permissions

Please note: Selecting permissions does not provide access to the full text of the article, please see our help page How do I view content?

To request a reprint or corporate permissions for this article, please click on the relevant link below:

Academic Permissions

Please note: Selecting permissions does not provide access to the full text of the article, please see our help page How do I view content?

Obtain permissions instantly via Rightslink by clicking on the button below:

If you are unable to obtain permissions via Rightslink, please complete and submit this Permissions form. For more information, please visit our Permissions help page.