Figures & data
Figure 1. Type I toxin-antitoxin chromosomal regions in B. subtilis. Toxins are shown as blue, potential toxins as hatched blue and antitoxins as red arrows, while ORFs in the neighbourhood of TA systems are shown as grey arrows. Prophages are indicated to the left.
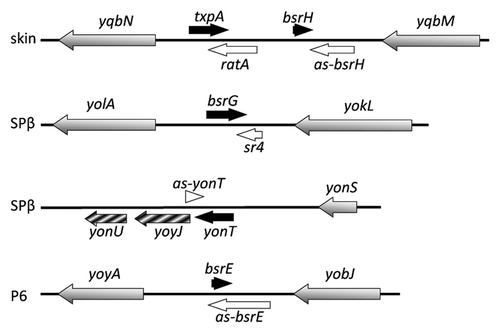
Figure 2. Alignment of type I toxins using ClustalW. Conserved amino acids are marked with an asterisk (*), strongly similar amino acids with a colon (:), and weakly similar amino acids with a full stop (.). The transmembrane domain predicted with TMpred (http://www.ch.embnet.org/software/TMPRED_form.html) is shaded; charged amino acids are in red.
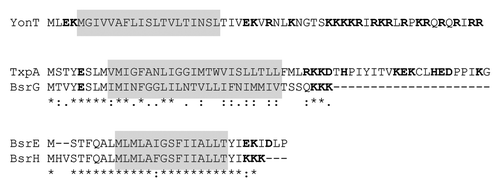
Figure 3. Alignment of B subtilis proteins from the YhzE family. Conserved amino acids are marked with an asterisk (*), strongly similar amino acids with a colon (:), and weakly similar amino acids with a full stop (.). The conserved hydrophobic region is shaded; aromatic amino acids are in green.
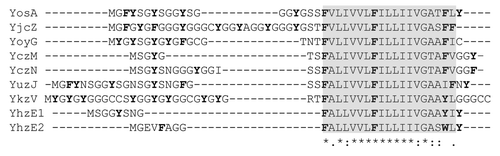
Figure 4. Secondary structures of txpA, RatA and the txpA/RatA duplex. (A) Secondary structure of individual txpA and RatA RNAs, showing the potential loop-loop (kissing) interaction between stem-loop (SL) 6 of txpA and the transcription terminator (ter) of RatA, and between the terminator of txpA and SL3 of RatA (Durand et al, submitted). The start and stop codons of txpA are underlined and the Shine-Dalgarno (SD) sequence is indicated. (B) Secondary structure of extended duplex between txpA and RatA. Major sites of RNase III cleavage are indicated.
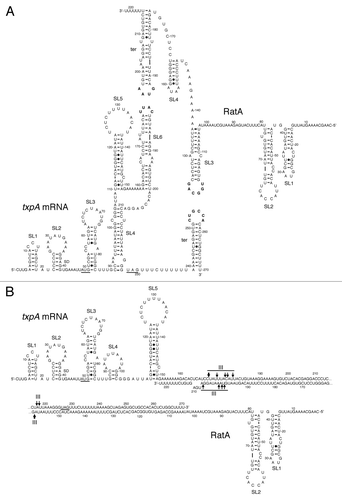
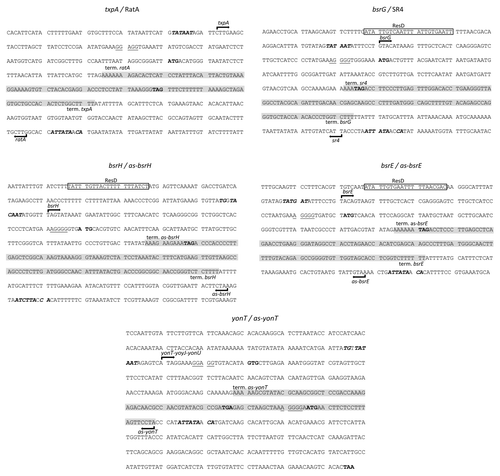
Figure 5. Nucleotide sequences of type I toxin-antitoxins. Only the toxin-encoding strand is shown. Mapped (txpA and bsrG) and predicted (bsrE and bsrH) -10 boxes of the promoters are in bold-type. Transcription start sites are indicated by arrows and transcription termination is indicated by “term”. The complementary region between the toxin and antitoxin RNAs is shaded in yellow. Start and stop codons are in red. Putative ResD binding sites are shaded in light-brown. The predicted SD sequences are boxed.