1,449
Views
55
CrossRef citations to date
0
Altmetric
Research Paper

Genome-wide profiling of Hfq-binding RNAs uncovers extensive post-transcriptional rewiring of major stress response and symbiotic regulons in Sinorhizobium meliloti

, , , , , , , & show all
Pages 563-579 | Received 13 Jan 2014, Accepted 14 Feb 2014, Published online: 26 Feb 2014

Figures & data

Figure 1. Identification of Hfq-binding transcripts in S. meliloti. (A) Experimental setup. Chromosomal hfq region in S. meliloti with indication of tagging in the Sm2B3001 derivative strain SmhfqFLAG (coordinates according to the annotation of the reference S. meliloti 1021 genome). Below is a western blot probed with Anti-FLAG M2® antibodies showing the specific recognition and recovery of the FLAG-tagged Hfq in the different protein fractions from TY exponential cultures of SmhfqFLAG during CoIP. As a control the same fractions from the wild-type (wt) strain Sm2B3001 were similarly probed. CoIP–RNA was recovered from Hfq–RNA complexes (IP fraction) derived from Sm2B3001, SmpWsinIFLAG, and SmhfqFLAG strains grown to exponential and stationary phases in TY and upon cold, heat, and salt shocks. cDNA libraries for sequencing were generated from control and Hfq CoIP–RNA samples (see text for details). (B) Classification of Hfq-bound transcripts. A schematic of the different types of Hfq RNA species according to the MTU model described in Materials and Methods is shown on the upper panel. Lower panels show the number of Hfq-bound RNAs in both each category (left circle diagram) and cDNA library (right Venn diagram).
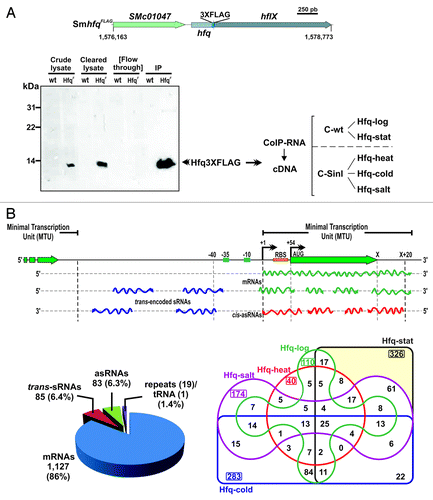
Figure 1. Identification of Hfq-binding transcripts in S. meliloti. (A) Experimental setup. Chromosomal hfq region in S. meliloti with indication of tagging in the Sm2B3001 derivative strain SmhfqFLAG (coordinates according to the annotation of the reference S. meliloti 1021 genome). Below is a western blot probed with Anti-FLAG M2® antibodies showing the specific recognition and recovery of the FLAG-tagged Hfq in the different protein fractions from TY exponential cultures of SmhfqFLAG during CoIP. As a control the same fractions from the wild-type (wt) strain Sm2B3001 were similarly probed. CoIP–RNA was recovered from Hfq–RNA complexes (IP fraction) derived from Sm2B3001, SmpWsinIFLAG, and SmhfqFLAG strains grown to exponential and stationary phases in TY and upon cold, heat, and salt shocks. cDNA libraries for sequencing were generated from control and Hfq CoIP–RNA samples (see text for details). (B) Classification of Hfq-bound transcripts. A schematic of the different types of Hfq RNA species according to the MTU model described in Materials and Methods is shown on the upper panel. Lower panels show the number of Hfq-bound RNAs in both each category (left circle diagram) and cDNA library (right Venn diagram).

Figure 2. Identification of Hfq-associated sRNAs. (A) Number of annotated and newly identified trans-sRNAs and asRNAs scored as Hfq-bound and their replicon distribution in S. meliloti. Latter values are relative to the sizes (Mb) of chromosome (Chr.) and megaplasmids pSymB and pSymA. (B) IGB visualization of the clone distribution over selected Hfq-dependent and -independent sRNAs. Shown are cDNA clusters corresponding to tmRNA (ssrA), SmelA060 (trans-sRNA), and SMc_Hfq_asRNA_11 (asRNA) in control and Hfq CoIP–RNA as indicated. The vertical axis indicates the number of sequencing reads that were obtained. Relevant genomic information for each sRNA is provided in the schematics below the plots. The asterisk indicates the tmRNA processing site. (C) Selective stabilization of CoIP-enriched sRNAs by Hfq. Northern analysis of Smr7C, SmelC289, and SmelC457 decay in Sm2B3001 (wt) and its hfq deletion mutant derivative (∆hfq) upon transcription arrest with rifampicin. Samples of exponentially growing bacteria in TY were withdrawn prior to or at the indicated time-points (in min) after antibiotic addition. Hybridization signal intensities were normalized to those of the 5S rRNA in each RNA sample to calculate the half-life of the transcripts (indicated in min). IGB plots for these sRNAs (as in B) are shown above each panel.
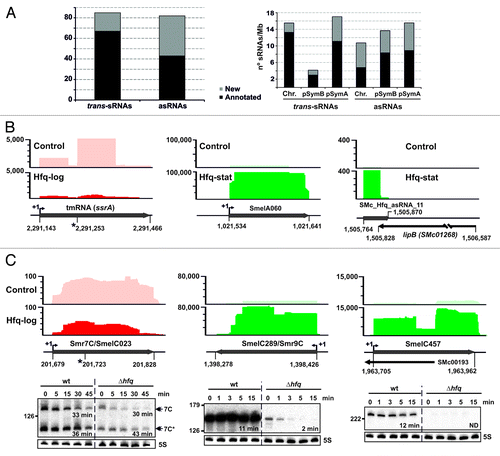
Figure 2. Identification of Hfq-associated sRNAs. (A) Number of annotated and newly identified trans-sRNAs and asRNAs scored as Hfq-bound and their replicon distribution in S. meliloti. Latter values are relative to the sizes (Mb) of chromosome (Chr.) and megaplasmids pSymB and pSymA. (B) IGB visualization of the clone distribution over selected Hfq-dependent and -independent sRNAs. Shown are cDNA clusters corresponding to tmRNA (ssrA), SmelA060 (trans-sRNA), and SMc_Hfq_asRNA_11 (asRNA) in control and Hfq CoIP–RNA as indicated. The vertical axis indicates the number of sequencing reads that were obtained. Relevant genomic information for each sRNA is provided in the schematics below the plots. The asterisk indicates the tmRNA processing site. (C) Selective stabilization of CoIP-enriched sRNAs by Hfq. Northern analysis of Smr7C, SmelC289, and SmelC457 decay in Sm2B3001 (wt) and its hfq deletion mutant derivative (∆hfq) upon transcription arrest with rifampicin. Samples of exponentially growing bacteria in TY were withdrawn prior to or at the indicated time-points (in min) after antibiotic addition. Hybridization signal intensities were normalized to those of the 5S rRNA in each RNA sample to calculate the half-life of the transcripts (indicated in min). IGB plots for these sRNAs (as in B) are shown above each panel.

Figure 3. Expression profiling of the Hfq-dependent sRNAs. (A) Venn diagrams indicating the number of Hfq-bound trans-sRNAs and asRNAs identified in each CoIP–RNA library. (B) Northern analysis of the expression of selected Hfq-bound sRNAs. Total RNA was obtained from strain Sm2B3001 grown in the conditions of CoIP experiments. Growth in GMS medium was included as the reference for osmotic upshift induction. Sizes of each transcript as inferred from RNAseq data are indicated with a double arrowhead to the right. RPKM-normalized recovery rates of these sRNAs in each Hfq CoIP–RNA library were plotted under the blots according to the color scale shown in the middle.
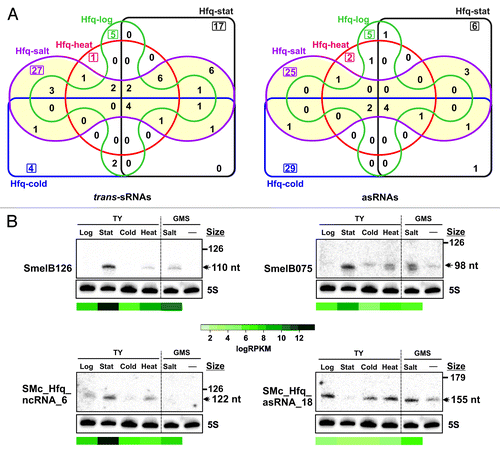
Figure 3. Expression profiling of the Hfq-dependent sRNAs. (A) Venn diagrams indicating the number of Hfq-bound trans-sRNAs and asRNAs identified in each CoIP–RNA library. (B) Northern analysis of the expression of selected Hfq-bound sRNAs. Total RNA was obtained from strain Sm2B3001 grown in the conditions of CoIP experiments. Growth in GMS medium was included as the reference for osmotic upshift induction. Sizes of each transcript as inferred from RNAseq data are indicated with a double arrowhead to the right. RPKM-normalized recovery rates of these sRNAs in each Hfq CoIP–RNA library were plotted under the blots according to the color scale shown in the middle.

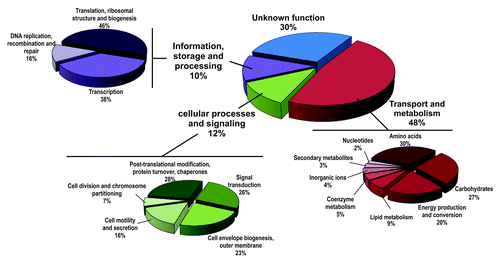
Figure 4. Functional distribution of the Hfq-bound mRNAs according to the COG database.

Figure 4. Functional distribution of the Hfq-bound mRNAs according to the COG database.

Figure 5. Enrichment patterns of Hfq-associated RNA species derived from mRNAs. (A) Recovery of mRNAs of major metabolic, stress, and symbiotic pathways. The clone distribution over the mRNAs is represented by an IGB stairstep diagram of fold enrichment in the indicated Hfq–CoIP RNA with respect to the control CoIP. The vertical axis indicates the enrichment factors. ORFs of the mRNAs are shown by arrows under each IGB plot. Numbers denote genomic positions of the recovered transcripts according to Table S3. TSSs are indicated if known. (B) Alternative distribution patterns of cDNA clusters over Hfq-bound mRNAs. Information has been diagrammed as in (A). Data correspond to the recovery of these three mRNAs in the Hfq-salt library.
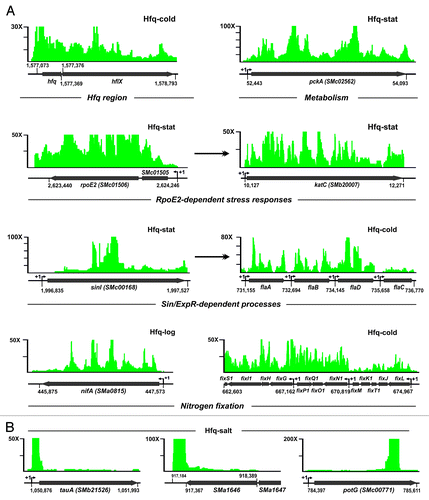
Figure 5. Enrichment patterns of Hfq-associated RNA species derived from mRNAs. (A) Recovery of mRNAs of major metabolic, stress, and symbiotic pathways. The clone distribution over the mRNAs is represented by an IGB stairstep diagram of fold enrichment in the indicated Hfq–CoIP RNA with respect to the control CoIP. The vertical axis indicates the enrichment factors. ORFs of the mRNAs are shown by arrows under each IGB plot. Numbers denote genomic positions of the recovered transcripts according to Table S3. TSSs are indicated if known. (B) Alternative distribution patterns of cDNA clusters over Hfq-bound mRNAs. Information has been diagrammed as in (A). Data correspond to the recovery of these three mRNAs in the Hfq-salt library.

Figure 6. Targeting of the SMa0495 (A) and prbA (B) mRNAs by the AbcR1 and AbcR2 sRNAs. IntaRNA predicted duplexes are shown, with the RBS and AUG start codons of the SMa0495 and prbA mRNAs underlined. In these diagrams, numberings denote positions relative to the AUG start codon of the mRNA and the TSS of AbcR1 and AbcR2. The predicted minimum hybridization energy (E) is indicated in each case. The IGB diagrams show the fold enrichment (vertical axis) of these mRNAs in the indicated Hfq CoIP–RNA library. Schematics of the reporter fusions cloned in plasmid pR-EGFP are shown below the genomic information of each mRNA. The histograms show the fluorescence of the reporter S. meliloti double deletion mutant (∆R1/2) co-transformed with the target fusions and plasmids pSRK (empty control vector), pSRK-R1 (R1+), or pSRK-R2 (R2+). Values reported are means and standard deviation of 48 fluorescence measurements, i.e., four determinations in three independent exponential cultures of four double transconjugants representing each plasmid combination. Fluorescence values were normalized to culture OD600 (F/OD). Background fluorescence from strains harboring pSRK and the empty pR-EGFP plasmid instead of the target fusions was subtracted from the fluorescence of target fusions. Relevant subsections of 2D-PAGE gels revealing downregulation of the periplasmic protein PrbA (double arrowhead) by both AbcR1 and AbcR2 sRNAs are also shown. Periplasmic protein extracts were obtained from exponential cultures of S. meliloti single mutants ∆R1 and ∆R2 carrying pSRK or either pSRK-R1 (R1+) or pSRK-R2 (R2+) as indicated. Expression/absence (+/−) of AbcR1 and AbcR2 (R1/2) in each strain is indicated in brackets. Note that AbcR1 is highly expressed from the chromosome whereas AbcR2 is almost absence in exponentially growing bacteria.Citation42
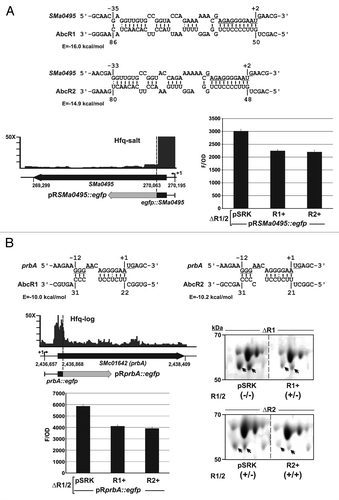
Figure 6. Targeting of the SMa0495 (A) and prbA (B) mRNAs by the AbcR1 and AbcR2 sRNAs. IntaRNA predicted duplexes are shown, with the RBS and AUG start codons of the SMa0495 and prbA mRNAs underlined. In these diagrams, numberings denote positions relative to the AUG start codon of the mRNA and the TSS of AbcR1 and AbcR2. The predicted minimum hybridization energy (E) is indicated in each case. The IGB diagrams show the fold enrichment (vertical axis) of these mRNAs in the indicated Hfq CoIP–RNA library. Schematics of the reporter fusions cloned in plasmid pR-EGFP are shown below the genomic information of each mRNA. The histograms show the fluorescence of the reporter S. meliloti double deletion mutant (∆R1/2) co-transformed with the target fusions and plasmids pSRK (empty control vector), pSRK-R1 (R1+), or pSRK-R2 (R2+). Values reported are means and standard deviation of 48 fluorescence measurements, i.e., four determinations in three independent exponential cultures of four double transconjugants representing each plasmid combination. Fluorescence values were normalized to culture OD600 (F/OD). Background fluorescence from strains harboring pSRK and the empty pR-EGFP plasmid instead of the target fusions was subtracted from the fluorescence of target fusions. Relevant subsections of 2D-PAGE gels revealing downregulation of the periplasmic protein PrbA (double arrowhead) by both AbcR1 and AbcR2 sRNAs are also shown. Periplasmic protein extracts were obtained from exponential cultures of S. meliloti single mutants ∆R1 and ∆R2 carrying pSRK or either pSRK-R1 (R1+) or pSRK-R2 (R2+) as indicated. Expression/absence (+/−) of AbcR1 and AbcR2 (R1/2) in each strain is indicated in brackets. Note that AbcR1 is highly expressed from the chromosome whereas AbcR2 is almost absence in exponentially growing bacteria.Citation42

Figure 7. Summary of the Hfq–RNA interactions in S. meliloti. Double arrowheads stand for direct targeting by Hfq of sRNAs and mRNAs encoding transport and metabolic enzymes, proteins of the ExpR/Sin and global stress regulons, regulators of nitrogen fixation, and ribosome and membrane components. Single arrowheads denote reported transcriptional regulation. Hfq-bound sRNAs could be on the basis of the post-transcriptional regulation of some mRNA genes. This work extended the list of validated AbcR1/2 targets to the prbA and SMa0495 ABC transporter mRNAs. OM, outer membrane; P, periplasmic space; CM; cytoplasmic membrane.
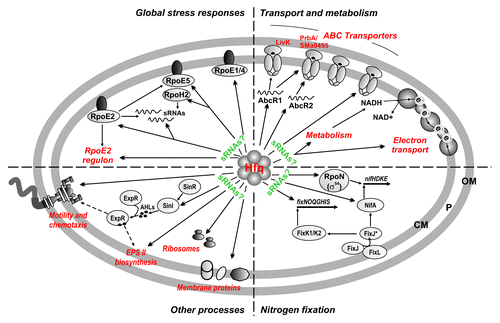
Figure 7. Summary of the Hfq–RNA interactions in S. meliloti. Double arrowheads stand for direct targeting by Hfq of sRNAs and mRNAs encoding transport and metabolic enzymes, proteins of the ExpR/Sin and global stress regulons, regulators of nitrogen fixation, and ribosome and membrane components. Single arrowheads denote reported transcriptional regulation. Hfq-bound sRNAs could be on the basis of the post-transcriptional regulation of some mRNA genes. This work extended the list of validated AbcR1/2 targets to the prbA and SMa0495 ABC transporter mRNAs. OM, outer membrane; P, periplasmic space; CM; cytoplasmic membrane.
Supplemental material

Additional material

Download Zip (1.3 MB)

Reprints and Corporate Permissions

Please note: Selecting permissions does not provide access to the full text of the article, please see our help page How do I view content?

To request a reprint or corporate permissions for this article, please click on the relevant link below:

Academic Permissions

Please note: Selecting permissions does not provide access to the full text of the article, please see our help page How do I view content?

Obtain permissions instantly via Rightslink by clicking on the button below:

If you are unable to obtain permissions via Rightslink, please complete and submit this Permissions form. For more information, please visit our Permissions help page.