Figures & data
Figure 1. Sequence and secondary structure of purine-sensing riboswitches. (A) Secondary structure of the full-length pbuE adenine-sensing riboswitch without adenine (OFF-state) and of the aptamer domain with bound adenine (ON-state). The switching sequence in the aptamer domain is shaded in gray. Nucleotides in red are conserved in greater than 90% of the known examples for this riboswitch class. (B) P1long aptamer domain with 4 additional GC base pairs within helix P1. (C) Surface presentation of the X-ray structure of the aptamer domain of the add adenine riboswitch.Citation21 Helices P1, P2, P3 and the binding pocket are distinguished by different colors using the same coloring schema as in D. (D) Alignment of five representative sequences of mRNA domains that conform with the purine riboswitch consensus sequence. Organism’s abbreviations: Bacillus subtilis (BS), Clostridium perfringens (CP), Vibrio vulnificus (VV). Specificity for binding of either adenine or guanine is established by WC base pairing to the riboswitch nucleotide at position 74 (U for adenine, C for guanine). Regions with colored background represent helices P1, P2, and P3. Junctions connecting helices are notated J1–2, J2–3, and J3–1. Nucleotides in red are conserved in greater than 90% of the known examples for this riboswitch class.
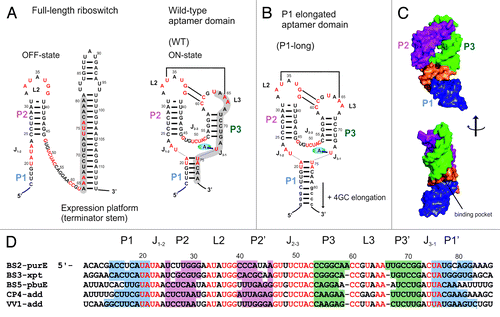
Figure 2. Mg2+ and adenine binding to the P1-long aptamer domain ([RNA] = 0.5 mM). Imino regions of the 2D- 1H,15N-HSQC spectra (left) and 2D-1H,1H-NOESY spectra with 200 ms mixing time (right) measured at 900 MHz and 283 K. Color code for assignments is adapted to the presentation of the secondary structures in D. (A) Overlay of the imino regions with Mg2+ (5 mM) and/or adenine (1.5 eq). Inset shows the 1D projection of the imino signal of the residue U22. (B) RNA with Mg2+ (5 mM). (C) Free RNA. (D) Model for secondary structures of the aptamer domain according to assignments in A, B, and C. Base pairs with assigned imino proton are indicated by a solid line. Dashed lines in apo-I state indicate less table base pairs according to the lower signal intensities of loop residues. Adenine is depicted with a red circle.
![Figure 2. Mg2+ and adenine binding to the P1-long aptamer domain ([RNA] = 0.5 mM). Imino regions of the 2D- 1H,15N-HSQC spectra (left) and 2D-1H,1H-NOESY spectra with 200 ms mixing time (right) measured at 900 MHz and 283 K. Color code for assignments is adapted to the presentation of the secondary structures in D. (A) Overlay of the imino regions with Mg2+ (5 mM) and/or adenine (1.5 eq). Inset shows the 1D projection of the imino signal of the residue U22. (B) RNA with Mg2+ (5 mM). (C) Free RNA. (D) Model for secondary structures of the aptamer domain according to assignments in A, B, and C. Base pairs with assigned imino proton are indicated by a solid line. Dashed lines in apo-I state indicate less table base pairs according to the lower signal intensities of loop residues. Adenine is depicted with a red circle.](/cms/asset/051c3188-135d-4895-9c1e-5c2f79099b57/krnb_a_10929439_f0002.gif)
Figure 3. Mg2+-induced changes of the P1-long aptamer domain ([RNA] = 0.5 mM): Overlay of imino regions of 2D- 1H,15N-HSQC spectra with different Mg2+-concentrations (0 to 5 mM). Insets show expansions of different imino signals. Signals labeled with a star (*) belong to heterogeneous conformations that are not assigned (apo-I*) and disappear upon addition of Mg2+ without chemical shift changes. Assigned signals (e.g., G37, U31) from the apo-I conformation shift to the position of signals corresponding to the apo-II conformation as indicated by an arrow.
![Figure 3. Mg2+-induced changes of the P1-long aptamer domain ([RNA] = 0.5 mM): Overlay of imino regions of 2D- 1H,15N-HSQC spectra with different Mg2+-concentrations (0 to 5 mM). Insets show expansions of different imino signals. Signals labeled with a star (*) belong to heterogeneous conformations that are not assigned (apo-I*) and disappear upon addition of Mg2+ without chemical shift changes. Assigned signals (e.g., G37, U31) from the apo-I conformation shift to the position of signals corresponding to the apo-II conformation as indicated by an arrow.](/cms/asset/bbc5c550-71b7-4988-a301-e815b235db5a/krnb_a_10929439_f0003.gif)
Figure 4. Mg2+ and adenine binding to the wild-type aptamer domain ([RNA] = 0.5 mM). Imino regions of the 2D- 1H,15N-HSQC spectra (left) and 2D-1H,1H-NOESY spectra with 200 ms mixing time (right) measured at 900 MHz and 283 K. NOE connectivities highlighted by solid lines indicate the major conformation, dashed lines (and *) indicate the minor conformation. The color code used for visualizing the assignments is also adopted in the presentation of the secondary structure in D. (A) RNA with Mg2+ (5 mM) and adenine (1.5 eq). (B) RNA with Mg2+ (5 mM). (C) Free RNA. (D) Model for secondary structures of the aptamer domain according to assignments in A, B and C. Base pairs with assigned imino protons are indicated by solid line. Adenine is depicted with a red circle.
![Figure 4. Mg2+ and adenine binding to the wild-type aptamer domain ([RNA] = 0.5 mM). Imino regions of the 2D- 1H,15N-HSQC spectra (left) and 2D-1H,1H-NOESY spectra with 200 ms mixing time (right) measured at 900 MHz and 283 K. NOE connectivities highlighted by solid lines indicate the major conformation, dashed lines (and *) indicate the minor conformation. The color code used for visualizing the assignments is also adopted in the presentation of the secondary structure in D. (A) RNA with Mg2+ (5 mM) and adenine (1.5 eq). (B) RNA with Mg2+ (5 mM). (C) Free RNA. (D) Model for secondary structures of the aptamer domain according to assignments in A, B and C. Base pairs with assigned imino protons are indicated by solid line. Adenine is depicted with a red circle.](/cms/asset/22c54e66-4bf7-4771-85d8-048ea0c8182e/krnb_a_10929439_f0004.gif)
Figure 5. Intensity of imino protons of wild-type (A) and P1-long (B) RNA in 1H, 15N-HSQC spectra ( and ) in the free state (top), with Mg2+ (middle), with Mg2+ and/or adenine (bottom). Assignments with and without star (*) indicate two different conformations of the same residue; the intensity of the second peak is indicated by dark gray bar. Signal intensities are normalized to the intensity of the residue G42 in each spectrum. Imino signals are grouped into structural elements (helices P1, P2, P3, binding pocket, loop L2) and translated into structural models on the right side. The color code of structural elements is the same as in .
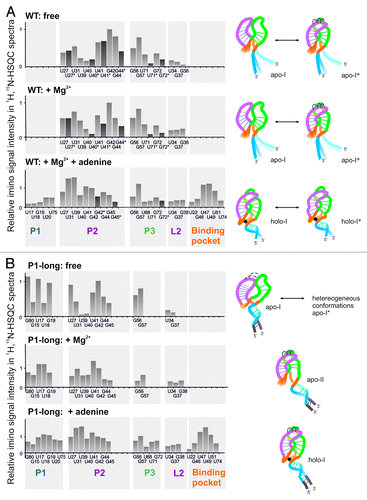
Figure 6. Thermal stability and binding kinetics of the wild-type and P1-long aptamer domains. (A) Melting point (Tm) derived from the first derivative of the melting curve measured with CD spectroscopy at different conditions. (B) Ligand dissociation constants, association and dissociation rate constants at different temperatures obtained from fluorescence spectroscopy with 2-AP (50 nM) in the presence of 4mM Mg2+.
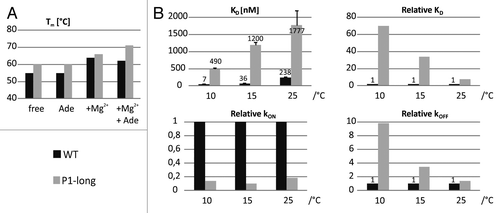
Table 1. Kinetic and thermodynamic data for 2-AP binding to the adenine-sensing aptamer domain obtained by fluorescence spectroscopy
Figure 7. Global packing of the helices and organization of the aptamer domain. Helix-helix interactions are determined by different factors that influence stability of helices P1, P2, and P3.
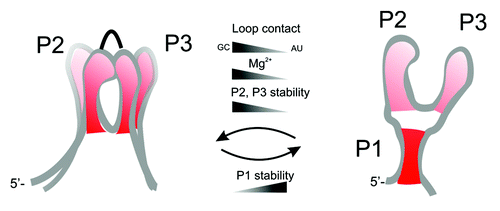
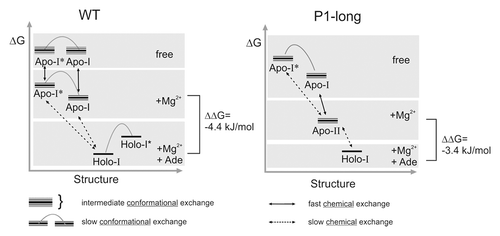
Figure 8. Schematic energy-structure diagram for Mg2+ and adenine dependent equilibria of the wild-type (left) and P1-long (right) aptamer domains.
