Figures & data
Figure 1 Sequence specific inhibition of HIV-1 replication in MOLT-4 cells expressing shRNA targeting HIV-1 promoter region. (A) The sequence targeted by the shPromA within HIV-1 promoter region of U3 is indicated in blue. The alignment of shRNA targeting NFκB sites (shPromA), four variants (shPromA M1–4), and scrambled control of shPromA (shPromA Sc) is shown below. Mismatches are indicated in red. Underlining indicates NFκB binding sites in the HIV-1 promoter region. The start site of HIV-1 mRNA transcription is indicated by an arrow. (B) Sequence dependent inhibition of HIV-1 replication was achieved. HIV replication was detected by reverse transcriptase (RT) assay in culture supernatants post infection at days 4, 7, 11. The mean values of three independent experiments are plotted. (C) Alignment of HIV-1 and HIV-2 NFκB binding regions. NFκB binding regions are underlined. Sequence targeted by shPromA is highlighted in blue. The letters in red indicate sequence differences in HIV-2 U3 promoter region. (D) Sequence dependent inhibition of viral infection was achieved. HIV-1 and HIV-2 replication was detected by RT levels in culture supernatants post infection at days 2, 6, 10. MOLT-4 shPromA cells were able to suppress HIV-1 infection but failed to suppress HIV-2 replication. MOLT-4 cells not expressing shPromA showed increasing levels of HIV-1 and HIV-2 over the 10 day time course. The mean values of three independent experiments are plotted.
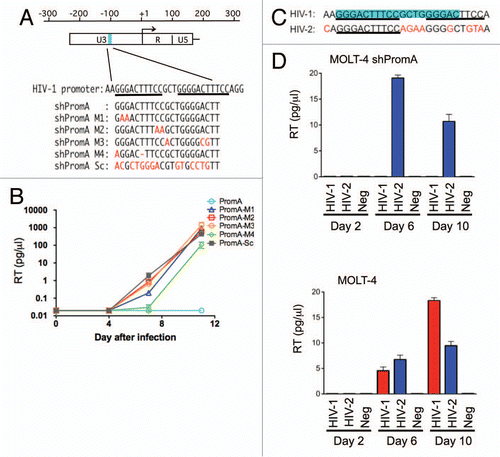
Figure 2 Evidence of shRNA transcription in MOLT-4 cells. (A) A schematic of the procedure used for detection of antisense strand expression following shRNA transcription. The shRNA expression unit consisting of sense, loop, and antisense strands of shRNA sequences is transcribed under the control of the U6 promoter. RNA was extracted from MOLT-4 cells expressing various shPromA constructs, followed by two step in vitro reaction of polyadenylation mediated by the polynucleotide adenylyltransferase and cDNA synthesis from 3′ end of the shRNA sequence using an oligo(dT) primer with a universal tag. Sequence specific PCR was used to detect the newly synthesized cDNA using the primer for the universal tag paired with specific antisense primers (asp). Detection of the loop strand and the sense strands employed a similar approach. (B) Alignment of the shPromA and variant sequences with the positions of specific 5′ PCR primers. The loop sequence is indicated by blue letters. The arrows indicate the positions of antisense specific primers (asp), sense specific primers (ssp) and loop specific primer (lsp). (C) Antisense specific primers specifically detect only the matched antisense strand of shRNA transcript. The ethidium bromide stained PCR bands were obtained after PCR with each specific antisense specific primer and universal primer. The antisense specific primers (asp) are listed on the left side of the gel image. Numbers 1–6 represent the MOLT-4 cells expressing shPromA or variants.
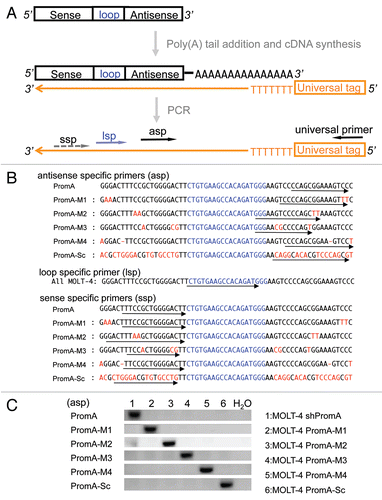
Figure 3 Evidence for efficient generation of mature/processed forms of double stranded siRNA from shRNA in MOLT-4 cells. (A) The schematic picture shows that the antisense strand and sense strand of shRNA transcripts with termination oligo-(U) sequences hybridize to form double-stranded with loop form of shRNA. A ribonuclease then cleaves the loop structure at indicated sites (indicated by red triangles). (B) The shRNA transcripts with loop structure can exist in four possible states without or with cleavage by ribonuclease as indicated in [1–4]. Estimated amplicon sizes are listed along with each of three specific primers. If the uncleaved shRNA [1] was dominant, the predicted size of PCR product amplified with ssp primer would be a longer amplicon (approximately 160 bp) compared with that detected with asp primer resulting in a band of approximately 120 bp in size. The predicted size of amplicon generated by the lsp primer would be intermediate in size (around 140 bp). If mature/processed double stranded siRNAs [2–4] are dominant, similar short amplicons would be generated by all each of ssp, asp and lsp primer sets, because polyadenylation is initiated at the 3′end of cleaved sense and loop strand.Citation79 (C) PCR amplicons generated using the strand specific primers in the MOLT-4 expressing shPromA and variants. Similar sized PCR amplicons were observed using each of three specific primer sets in the MOLT-4 cells. These results indicate complete processing of shRNA to siRNA. (D) Similar amounts processed/cleaved shRNA transcripts were expressed in all MOLT-4 cells. The cDNA reaction was carried out with 84 ng of total RNA as in , followed by Real-Time PCR analysis with universal loop specific primer. Estimated fold changes of cleaved loop structure of shRNA transcript in the MOLT-4 cells were shown relative to shPromA scrambled control based on delta-ct change. Means and standard errors of four independent experiments were shown. ns:Not significant, *p < 0.05.
![Figure 3 Evidence for efficient generation of mature/processed forms of double stranded siRNA from shRNA in MOLT-4 cells. (A) The schematic picture shows that the antisense strand and sense strand of shRNA transcripts with termination oligo-(U) sequences hybridize to form double-stranded with loop form of shRNA. A ribonuclease then cleaves the loop structure at indicated sites (indicated by red triangles). (B) The shRNA transcripts with loop structure can exist in four possible states without or with cleavage by ribonuclease as indicated in [1–4]. Estimated amplicon sizes are listed along with each of three specific primers. If the uncleaved shRNA [1] was dominant, the predicted size of PCR product amplified with ssp primer would be a longer amplicon (approximately 160 bp) compared with that detected with asp primer resulting in a band of approximately 120 bp in size. The predicted size of amplicon generated by the lsp primer would be intermediate in size (around 140 bp). If mature/processed double stranded siRNAs [2–4] are dominant, similar short amplicons would be generated by all each of ssp, asp and lsp primer sets, because polyadenylation is initiated at the 3′end of cleaved sense and loop strand.Citation79 (C) PCR amplicons generated using the strand specific primers in the MOLT-4 expressing shPromA and variants. Similar sized PCR amplicons were observed using each of three specific primer sets in the MOLT-4 cells. These results indicate complete processing of shRNA to siRNA. (D) Similar amounts processed/cleaved shRNA transcripts were expressed in all MOLT-4 cells. The cDNA reaction was carried out with 84 ng of total RNA as in Figure 1C, followed by Real-Time PCR analysis with universal loop specific primer. Estimated fold changes of cleaved loop structure of shRNA transcript in the MOLT-4 cells were shown relative to shPromA scrambled control based on delta-ct change. Means and standard errors of four independent experiments were shown. ns:Not significant, *p < 0.05.](/cms/asset/efced49e-9d30-43c5-ba48-a335ded47dc1/krnb_a_10916264_f0003.gif)
Figure 4 MOLT-4 cells expressing shPromA or variants display no change in surface expression of HIV receptor/coreceptor molecules CD4, CCR5, CXCR4, compared to untransduced MOLT-4 cells. Flow cytometry histograms (representative of 3 separate experiments) of CD4, CCR5 and CXCR4 revealed no difference in expression of these three surface molecules.
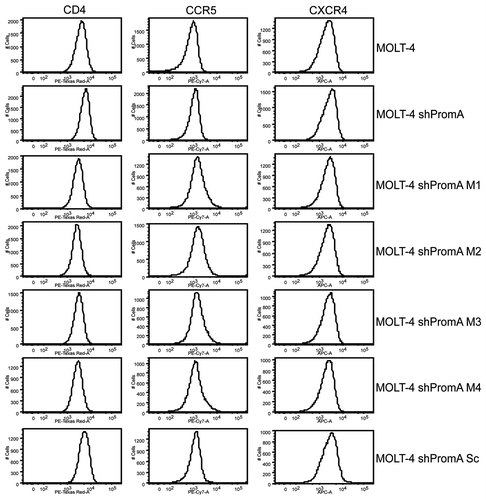
Figure 5 There is no significant difference in expression of mRNA from 86 NFκB driven genes in MOLT-4 cells stably transduced with shPromA, shPromA-M2 or shPromA-Sc. (A) Scatter plot of a log transformation of the relative expression of each gene (2 delta-Ct) comparing MOLT-4 expressing shPromA and MOLT-4 expressing shPromA-Sc. cDNA was synthesized from extracted RNA, followed by Real-Time PCR analysis. There was no significant difference in induction of NFκB driven genes by shPromA in MOLT-4 cells. (B) Scatter plot of a log transformation of the relative expression of each gene (2delta-Ct) between MOLT-4 expressing shPromA-M2 cells and MOLT-4 expressing shPromA-Sc cells. (C) Scatter plot of a log transformation of the relative expression of each gene (2delta-Ct) between TNFα stimulated MOLT-4 expressing shPromA cells and un-stimulated MOLT-4 shPromA cells. RNA was extracted 6 hours post stimulation for analysis. Most of NFκB driven genes were activated by TNFα stimulation. Plots for IFNα1, β1, γ, TNFRSF10A are indicated by arrows. The parallel two lines indicate a two-fold change in gene expression threshold. The mean of the triplicate experiments of each gene was used for this analysis.
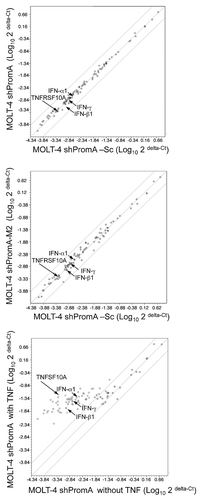
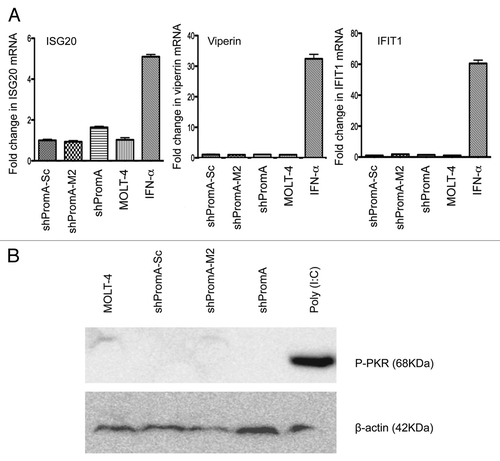
Figure 6 No significant off-target effects are induced by shPromA as determined by IFNα response genes and activation of PKR. (A) Three IFNα response genes (ISG20, Viperin and IFIT1) were not elevated in cells transduced with shPromA. The fold change for each mRNA is shown. Mean and standard error mean are plotted from triplicate experiments and the data was normalized to the value from MOLT-4 cells. The positive control was generated by treatment of cells for 24 h with IFNα (500 IU/mL). (B) Activation of phosphorylated PKR was not detected in shPromA-transduced cells. Western blot data were obtained from 150 µg of cellular extract. β-actin was used as loading control. Treatment with poly (I:C) (10 ng/mL for 6 h) was used as a positive control.
