Figures & data
Figure 1 Length distribution of human snoRNAs. Box C/D, box H/ACA and snoRNAs with atypical architecture (e.g., those with both a C/D and an H/ACA domain) are shown by different colors. The scaRNAs, characterized by an additional localization signal, belong to either one of these three classes. Their number is shown by the black curve.
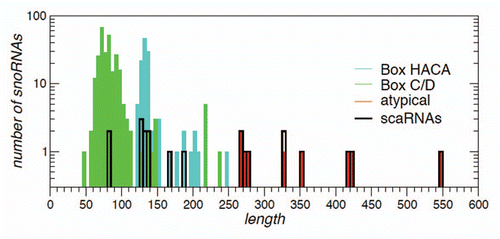
Figure 2 Schematic drawing of metazoan snoRNA structures. Recognizable conserved sequence boxes C, D, H and A (for ACA) are annotated. Boxes labeled G indicate the presence of guiding sequences as annotated in snoRNA-LBME-db. Conservation analysis of potential guide regions did not reveal any regions than those already annotated in snoRNA-LBme-db. Dotted lines indicate G/U-rich low-complexity regions.
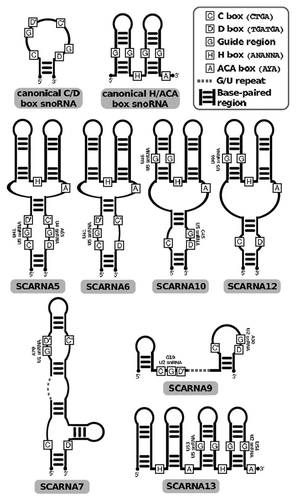
Figure 3 Distribution of infernal bit scores of the sequence of the 5′ component aligned to the covariance model of the 3′ component (R on L) and vice versa for SCARNA9 and SCARNA13. The background distribution (randomized sequences) is shown in gray. While there is no indication that the 5′ and 3′ components are related for SCARNA9, the shift of the bit score distributions towards higher values for SCARNA13 shows that the sequences of the two parts (L and R) of this snoRNA are more similar than expected. Although this does not constitute an iron-clad proof, it serves at least as a strong indication that L and R are homologs and like arose through a tandem duplication event.
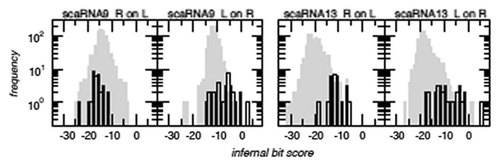
Figure 4 Distant homology of the SCARNA10 and SCARNA12 families. A comparison of infernal bit scores for alignments of SCARNA12 against the SCARNA10 covariance model (l.h.s., black histogram), and vice versa (r.h.s., black histogram) shows that the sequences of one family fit much better to the model of the other family than random sequences fitting the same secondary structure (gray background).
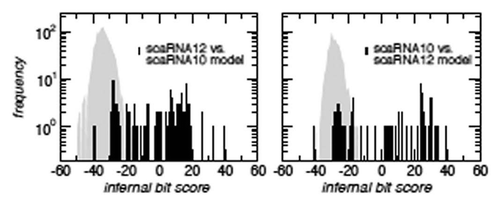
Figure 5 Location of the homologs of SCARNA5 and SCARNA6 in the ATG16L1 gene. Homology of introns was established by sequence alignments. The scaRNAs jumped to different positions several times during vertebrate evolution. Exons numbers correspond to the human gene.
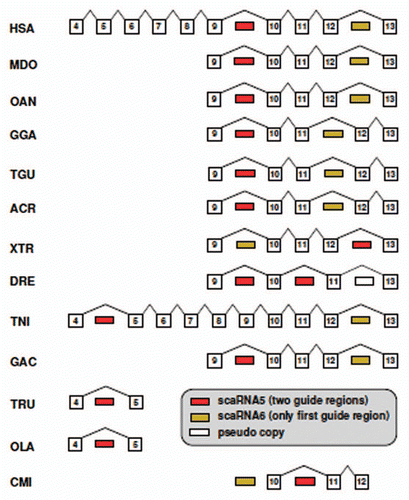
Table 1 Overview, phylogenetic distribution and host genes of 13 unnormal snoRNAs
Table 2 SNORD22 is part of a snoRNA cluster consisting of snR56 = SNORD25, SNORD26, SNORD27, SNORD28, SNORD29, SNORD30 and SNORD31 as displayed in the table from 5′ to 3′, according to ENSEMBL