Figures & data
Figure 1 Alternative splicing of the rat CaMKK2 gene. Diagram of the alternative splicing of rat CaMKK2 and the encoded variants. Exons (boxes) are numbered and their splicing patterns indicated with joined lines between exons. Arrowheads: primers used for RT-PCR of the endogeneous transcripts. *: the rat exon 17 corresponds to the exon 18 in human CaMKK2 named by Hsu et al. in JBC'97, 276:31113; rat exon corresponding to the human exon 17 were not found in the rat genome using BLAST searches, thus the rat protein products here corresponding to the human CaMKKβ1. Exon 16-encoded peptide sequences from rat and three other mammalian species are shown with unmatched amino acids highlighted. Among the protein domains, the exon 16-encoded region (hatched lines) is next to the CBD (Calcium-calmodulin-binding domain) and AID (autoinhibitory domain). The amino acid sequences of the resulting -COOH terminals of the rat CaMKK2 variants are aligned at the bottom, with the exon 16-encoded peptide underlined. Inclusion of the 43 nt exon 16 causes a frame shift leading to a longer -COOH terminal.
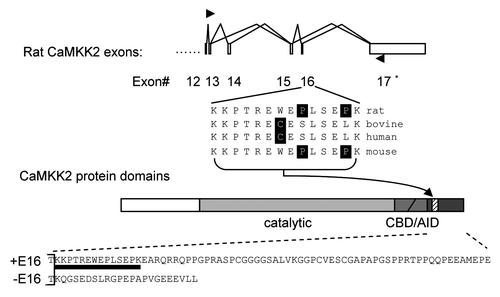
Figure 2 Cell-dependent effect of forskolin on exon 16 inclusion and the essential role of the PKA pathway in B35 cells. (A) A bar graph of the level of exon 16 inclusion upon treatment by forskolin (10 µM) with kinase inhibitors H89, PP1 and PP2 or their vehicle DMSO in PC12 cells. The level in the ethanol (ETOH)-treated samples is taken as 1.0. *p < 0.05. (B) cpt-cAMP and forskolin-induced PKA pathway increases the percentages of exon 16-included CaMKK2 transcripts (exon 16-containing band intensity/total product intensity) in B35 cells. Shown is a denaturing PAGE gel of spliced CaMKK2 variants in B35 cells non-treated (NT) or treated for 6 hours with either ethanol (ETOH), cpt-cAMP (100 µM) or forskolin (10 µM), with or without pretreatment with H89 (10 µM), as indicated above the gel. Indexes of exon 16 inclusion (relative to the NT sample level) are graphed under each lane (mean ± SEM, n = 17 except for forskolin, which is 10). Both of the CaMKK2 products contain exon 14, comprising the majority of transcripts (∼72%) encoding active CaMKK2 kinase isoforms in B35 cells. The kinase-dead exon 14-excluded variants are not shown here. **p < 0.01, ***p < 0.001. Nc: PCR negative control. (C) Effects of coexpressed Flag-PKA on splicing reporter minigenes in HEK293T cells. Upper, diagram of the splicing reporter minigenes containing CaMKK2 exon 16, ANXA11 exon 3 (Control 1) or P2RX4 exon 2 (Control 2). Boxes: exons; horizontal lines: introns; arrowheads: primers. Lower, PAGE gels of the RT-PCR products of the splicing reporters with coexpressed mutant (Mut) or wild-type (WT) Flag-PKA, with mean percentages of exon inclusion under each lane and exon-included or -excluded products indicated to the right. Lane 1 is a negative control of RT-PCR without reverse transcriptase. (D) A bar graph of the exon inclusion levels (mean ± SD) of the reporter minigenes and the PKA effect. The level in the PKA mutant (Mut)-coexpressing samples were taken as 1 for each reporter.
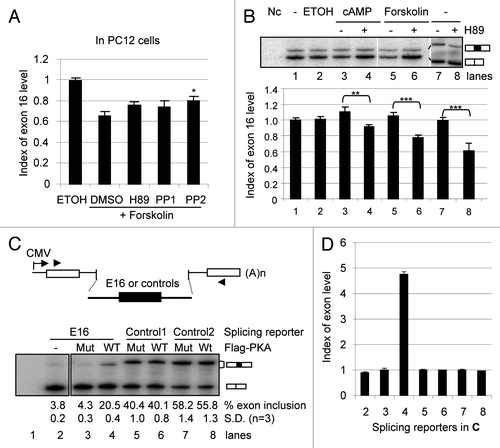
Figure 3 Biochemical properties of the Myc-CaMKK2 variants. (A) Upper, diagram of the Myc-CaMKK2 variants (domains are as in ). Lower, a western blot of Myc-CaMKK2 expressed in HE K293T cells probed with the anti-cMyc primary antibody. Both cDNAs contain exon 14 therefore encoding the kinase active isoforms. (B–D) Upper, In vitro kinase assays for the autophosphorylation (B) and phosphorylation of GST-CaMKIV (C) by Myc-CaMKK2 variants in the presence or absence of Ca2+ and Calmodulin (Ca-CaM), as indicated, as well as their phosphorylation by PKA (D). Phosphorylated Myc-CaMKK2 variants, PKA and GST-CaMKIV are indicated to the right of the gels. Lower, western blots with anti-cMyc or anti-CaMKIV antibodies accordingly, to show the protein input, as indicated. The level of the phosphorylation signals of the variants are indicated below the gels. (E) Phosphopeptide mapping of Myc-CaMKK2 −E16 and Myc-CaMKK2 +E16 immunoprecipitated from HE K293T cells with coexpressed wild type Flag-PKA. Left: immunoprecipitated 32P-labeled variant poteins (arrow head) used for peptide mapping. Spots consistently showed up for both variants are numbered to their left (#1–4) or right (#5–8). The intensities of spots #1 and 4 appear different here but not consistent between experiments, likely due to partial digestion. The Myc-CaMKK2 +E16-specific spot is circled. Orientations of the first (1°) and the second (2°) dimensions of the thin layer chromatography (TLC) plates are as indicated. (F) Transcriptional activities of Myc-CaMKK2 variants on a CRE (cAMP/calcium-responsive element) reporter in B35 cells in a dual-luciferase assay. Relative luciferase activities (mean ± SEM, n = 6) of either Myc-CaMKK2 −E16 (−E16) or Myc-CaMKK2 +E16 (+E16) were normalized to that of the vector control.
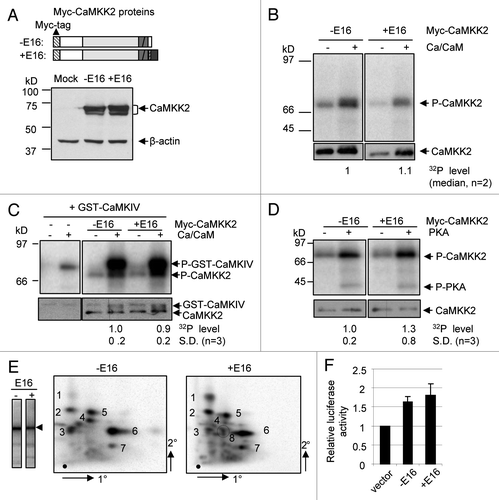
Figure 4 The endogenous CaMKK2 protein is localized in neurites and is required for forskolin-induced neurite growth in B35 cells. (A) B35 cells were treated with ethanol or 15 µM of forskolin for 12 h, fixed and incubated with Phalloidin-TRITC (left part), anti-CaMKKβ (CaMKK2, middle part) or DAPI (right part), and images collected through the respective filters as detailed in Methods. Magnification: 20x objective. (B) Distribution of CaMKK2 protein in the neurites of B35 cells treated with forskolin for 12 h. Images of Phalloidin-TRITC (left) and anti-CaMKKβ-stained (middle) neurites are merged into one (right), in red and green, respectively. Magnification: 100x objective. Images of the cell body staining are in the box at the upper-left corner of each image. (C–E) Effect on forskolin-induced neurite growth by RNA interference of the expression of the endogeneous CaMKK2 gene. At the left of (C) are representative images of the cells transfected with the vector pGIPz(-GFP) or the CaMKK2 shRNA plasmid shKK2(-GFP), as indicated. The dotted line marks the boundary of the GFP positive cell. The white arrowheads point to the GFP expressing cells. At the right is a bar graph of the relative levels of the CaMKK2 immunostaining intensities in control non-GFP cells (taken as the base level 1.0, C1 and C2 for GIPz and shKK2 plasmids, respectively) and in GFP positive (GIPz and shKK2 transfected) cells as indicated (mean ± SEM, n = 8 and 10 pairs, respectively). In (D and E) are the neurite lengths and branches per cell (mean ± SEM), respectively.
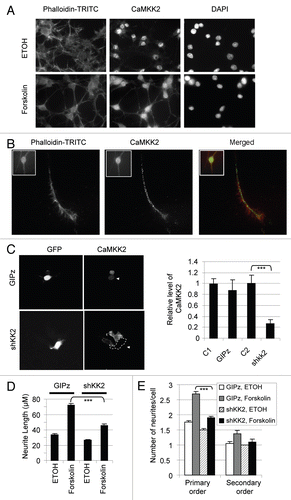
Figure 5 Myc-CaMKK2 variants differentially regulate forskolin-induced neurite growth of B35 cells. (A) Western blot of expressed Myc-CaMKK2 variants, with β-actin as a loading control. (B) Representative B35 cells expressing either Myc-CaMKK2 −E16 or Myc-CaMKK2 +E16, after forskolin (10 µM) or forskolin plus H89 treatment for 7 h. Shown are merged fluorescent images from anti-Myc antibody-immunostained (green) cells with the nuclei highlighted using DAPI (blue). (C) Mean (±SEM, n > 100, see text for details) neurite lengths of B35 cells expressing EGFP, Myc-CaMKK2 −E16 or Myc-CaMKK2 +E16. (D) Distribution of the neurite lengths (mean ± SEM) of the cells in (C). (E) Effects of Myc-CaMKK2 variants on neurite branching of the cells in (C). The bar graph shows the numbers (mean ± SEM) of primary, secondary and higher orders of neurites from each cell with the expression of EGFP, Myc-CaMKK2 −E16 or Myc-CaMKK2 +E16. Sample pairs with significant differences are marked with asterisks above the bars. *p < 0.05, **p < 0.01, ***p < 0.001. (F–I) Reduction of exon 16 changes forskolin-induced neurite growth. In (F) is a representative denaturing PAGE gel of RT-PCR products of B35 cells transfected with or without (NT) the 2′-OME oligos against the downstream 5′ splice site of exon 16 (E16) or a control exon. The oligo Control is derived from the ATM gene as detailed in the Methods. -: PCR negative control. In (G) are representative images of the transfected cells with ethanol or forskolin treatment. The far right column are larger views of the E16 oligo samples with several cells. In (H and I) are the bar graphs of the neurite lengths and number of branches per cell (mean ± SEM), respectively.
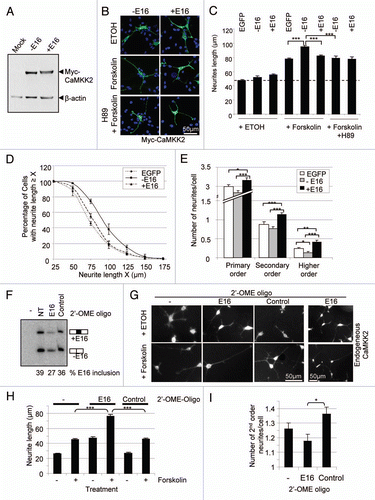
Figure 6 Brain-specific enrichment of the exon-16-containing transcripts. Shown are 32P-labeled RT-PCR products from an 8% denaturing PAGE gel, from RNA samples of different tissues as indicated above each lane. To the left are the molecular marker (M) sizes in nucleotides (nt). To the right are the expected product sizes and combination of exons 14 and 16 in each splice variant. -: PCR negative control lane for these samples. Beta-actin levels serve as RNA loading control and are shown below each lane. A bar graph of the level of CaMKK2 relative to beta-actin products from each lane is shown below the gels.
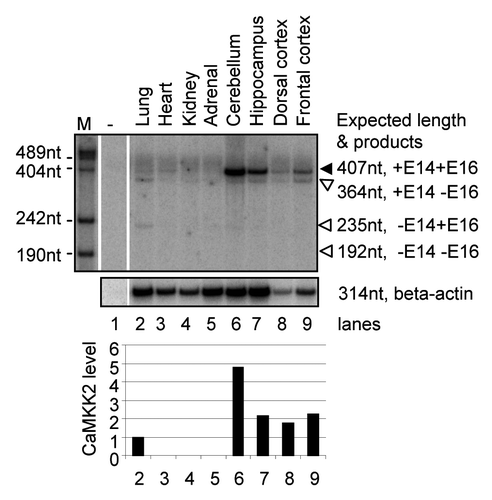
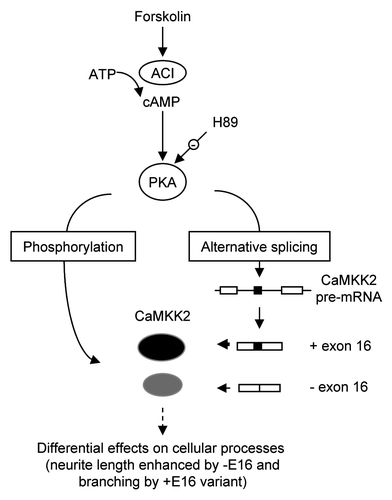
Figure 7 Summary for the splicing regulation of CaMKK2 by the PKA pathway. Stimulation of PKA by cpt-cAMP or forskolin increases the proportion of the CaMKK2 +E16 splice variant in B35 cells. The PKA effect on CaMKK2 exon 16 is inhibited by H89. The two CaMKK2 variants (black or gray ovals) are differentially phosphorylated by PKA. The CaMKK2 −E16 variant promotes the forskolin-induced neurite outgrowth while the CaMKK2 +E16 variant promotes neurite branching. ACI: adenylate cyclase type I.