723
Views
14
CrossRef citations to date
0
Altmetric
Research Paper

Rho family GTPase Chp/RhoV induces PC12 apoptotic cell death via JNK activation

, &
Pages 17-26 | Received 17 Sep 2010, Accepted 21 Feb 2011, Published online: 01 Mar 2011

Figures & data

Figure 1 Expression of Chp reduces viability of PC12TetOn cells. (A) Schematic structure of Chp GTPase. N-terminal proline-rich domain (amino acids 1–28), effector domain (53–77), C-terminal domain (208–236) and conserved amino acids G40 and S45 are shown by boxes. N-terminal domain binds to the SH3 domain of adaptor protein Grb2.Citation9 Effector domain is supposed to mediate binding to effector proteins. C-terminal domain is subjected to palmitoylation and regulates subcellular targeting of Chp.Citation9,Citation10 Substitution of Gly40 for Val (G40V) renders Chp constitutively active (GTP-bound). Substitution of Ser45 for Asp (S45N) renders Chp inactive (GDP-bound). (B) PC12TetOn clones with inducible expression of FLAG-Chp (wt5) and FLAG-ChpG40V (gv2, gv3, gv5 and gv7). Cells were grown on plastic for 48 hrs in the presence (+) or absence (−) of DOX. Cell lysates were analyzed by western blotting with indicated antibodies. (C) Quantification of cell viability in PC12TetOn clones grown for 7 days on collagen IV in 96-well plate in the presence (+) or absence (−) of DOX. Data are presented in arbitrary units (AU) of cellular dehydrogenase activity as mean values of three independent measurements ± SD indicated by error bars. Viability of non-treated cells (−) is set as 1.0. The data are representative of at least three independent experiments for each clone. An unpaired t-test was used to calculate two-tailed p-value. Expression of both wild type (wt5 clone) and active form (gv2, gv3, gv5 and gv7 clones) of Chp resulted in statistically significant decrease in viability of PC12TetOn cells. *p < 0.005. (D) Representative images of the same well of PC12gv5 cells grown as in (C) at the day of DOX addition (Day 0) and after 3 days (Day 3) of incubation in DOX-containing medium or medium without DOX are shown. On the day 3, the number of cells incubated with DOX-containing medium is clearly lower than the number of cells cultured in medium without DOX. Scale bar-100 µm.
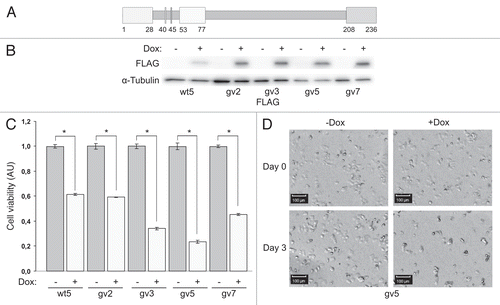
Figure 1 Expression of Chp reduces viability of PC12TetOn cells. (A) Schematic structure of Chp GTPase. N-terminal proline-rich domain (amino acids 1–28), effector domain (53–77), C-terminal domain (208–236) and conserved amino acids G40 and S45 are shown by boxes. N-terminal domain binds to the SH3 domain of adaptor protein Grb2.Citation9 Effector domain is supposed to mediate binding to effector proteins. C-terminal domain is subjected to palmitoylation and regulates subcellular targeting of Chp.Citation9,Citation10 Substitution of Gly40 for Val (G40V) renders Chp constitutively active (GTP-bound). Substitution of Ser45 for Asp (S45N) renders Chp inactive (GDP-bound). (B) PC12TetOn clones with inducible expression of FLAG-Chp (wt5) and FLAG-ChpG40V (gv2, gv3, gv5 and gv7). Cells were grown on plastic for 48 hrs in the presence (+) or absence (−) of DOX. Cell lysates were analyzed by western blotting with indicated antibodies. (C) Quantification of cell viability in PC12TetOn clones grown for 7 days on collagen IV in 96-well plate in the presence (+) or absence (−) of DOX. Data are presented in arbitrary units (AU) of cellular dehydrogenase activity as mean values of three independent measurements ± SD indicated by error bars. Viability of non-treated cells (−) is set as 1.0. The data are representative of at least three independent experiments for each clone. An unpaired t-test was used to calculate two-tailed p-value. Expression of both wild type (wt5 clone) and active form (gv2, gv3, gv5 and gv7 clones) of Chp resulted in statistically significant decrease in viability of PC12TetOn cells. *p < 0.005. (D) Representative images of the same well of PC12gv5 cells grown as in (C) at the day of DOX addition (Day 0) and after 3 days (Day 3) of incubation in DOX-containing medium or medium without DOX are shown. On the day 3, the number of cells incubated with DOX-containing medium is clearly lower than the number of cells cultured in medium without DOX. Scale bar-100 µm.

Figure 2 Expression of Chp results in PC12TetOn cell death. (A) Quantification of LDH release from PC12TetOn clones grown for 3 days on collagen IV in 96-well plate in the presence (+) or absence (−) of DOX. Data are presented in arbitrary units (AU) of LDH activity as mean values of three independent measurements ± SD indicated by error bars. LDH release from non-treated cells (−) is set as 1.0. The data are representative of at least two independent experiments for each clone. An unpaired t-test was used to calculate two-tailed p-value. Expression of both wild type (wt5 clone) and active form (gv2, gv3, gv5 and gv7 clones) of Chp resulted in statistically significant increase in cytotoxicity of PC12TetOn clones. *p < 0.005. (B) LDH release from gv5 cells cultured as in (A) but in the presence of different concentration of SP600125 (SP; 0, 0.5, 1, 2 and 5 µM). Data are presented in arbitrary units (AU) of LDH activity as mean values of three independent measurements ± SD indicated by error bars and are representative of two independent experiments. Treatment with 5 µM SP600125 has led to a statistically significant decrease in LDH release from gv5 cells compared to untreated cells. *p < 0.0001. (C) Quantification of gv5 cell viability. Cell viability was determined in the same experimental wells that were used for LDH activity measurement in (B). Data are presented in arbitrary units (AU) of cellular dehydrogenase activity as mean values of three independent measurements ± SD indicated by error bars. Treatment with 5 µM SP600125 (SP) along with DOX restored viability of gv5 cells. *p = 0.0001; n.s.—the difference is not statistically significant.
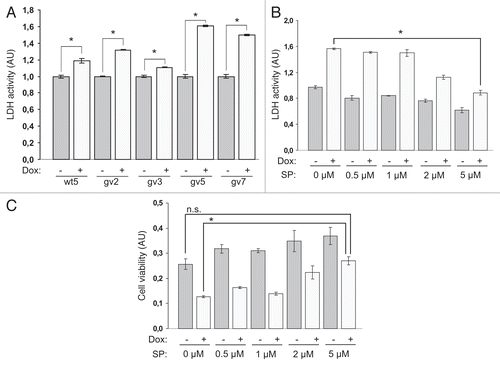
Figure 2 Expression of Chp results in PC12TetOn cell death. (A) Quantification of LDH release from PC12TetOn clones grown for 3 days on collagen IV in 96-well plate in the presence (+) or absence (−) of DOX. Data are presented in arbitrary units (AU) of LDH activity as mean values of three independent measurements ± SD indicated by error bars. LDH release from non-treated cells (−) is set as 1.0. The data are representative of at least two independent experiments for each clone. An unpaired t-test was used to calculate two-tailed p-value. Expression of both wild type (wt5 clone) and active form (gv2, gv3, gv5 and gv7 clones) of Chp resulted in statistically significant increase in cytotoxicity of PC12TetOn clones. *p < 0.005. (B) LDH release from gv5 cells cultured as in (A) but in the presence of different concentration of SP600125 (SP; 0, 0.5, 1, 2 and 5 µM). Data are presented in arbitrary units (AU) of LDH activity as mean values of three independent measurements ± SD indicated by error bars and are representative of two independent experiments. Treatment with 5 µM SP600125 has led to a statistically significant decrease in LDH release from gv5 cells compared to untreated cells. *p < 0.0001. (C) Quantification of gv5 cell viability. Cell viability was determined in the same experimental wells that were used for LDH activity measurement in (B). Data are presented in arbitrary units (AU) of cellular dehydrogenase activity as mean values of three independent measurements ± SD indicated by error bars. Treatment with 5 µM SP600125 (SP) along with DOX restored viability of gv5 cells. *p = 0.0001; n.s.—the difference is not statistically significant.

Figure 3 Chp induces apoptosis in PC12TetOn cells. Caspase-3/7 (A), caspase-8 (B) and caspase-9 (C) activities in parental PC12TetOn and wt5, gv5 and gv7 cells grown on collagen IV in 96-well plate for 48 hrs in the presence (+) or absence (−) of DOX. Data are presented in arbitrary units (AU) of caspase activity after normalization to cell viability as mean values of three independent measurements ± SD indicated by error bars. The data are representative of two independent experiments. An unpaired t-test was used to calculate two-tailed p-value. *p < 0.005; **p < 0.05; n.s.—the difference is not statistically significant. (D) Flow cytometry analysis of wt5 cells stained with Annexin V-FITC. Cells were grown on collagen IV for 72 hrs in the presence (+) or absence (−) of DOX, then stained with Annexin V-FITC and analyzed by flow cytometry. Chp-expressing cells (+DOX) show enhanced Annexin V-FITC reactivity indicating of onset of apoptosis.
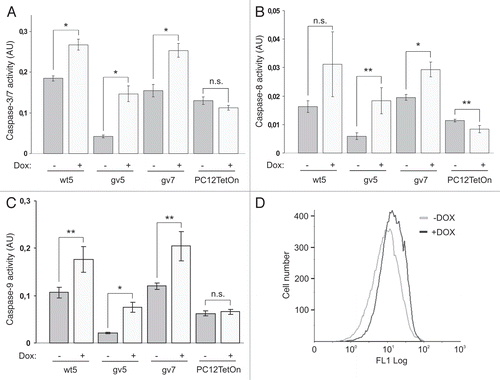
Figure 3 Chp induces apoptosis in PC12TetOn cells. Caspase-3/7 (A), caspase-8 (B) and caspase-9 (C) activities in parental PC12TetOn and wt5, gv5 and gv7 cells grown on collagen IV in 96-well plate for 48 hrs in the presence (+) or absence (−) of DOX. Data are presented in arbitrary units (AU) of caspase activity after normalization to cell viability as mean values of three independent measurements ± SD indicated by error bars. The data are representative of two independent experiments. An unpaired t-test was used to calculate two-tailed p-value. *p < 0.005; **p < 0.05; n.s.—the difference is not statistically significant. (D) Flow cytometry analysis of wt5 cells stained with Annexin V-FITC. Cells were grown on collagen IV for 72 hrs in the presence (+) or absence (−) of DOX, then stained with Annexin V-FITC and analyzed by flow cytometry. Chp-expressing cells (+DOX) show enhanced Annexin V-FITC reactivity indicating of onset of apoptosis.

Figure 4 Expression of Chp activates JNK in PC12TetOn cells. (A) wt5 and gv7 cells were grown on collagen IV in 35 mm dishes for 48 hrs in the presence (+) or absence (−) of DOX. Lysates were analyzed by western blotting to detect total levels of JNK, c-Jun, p38MAPK and their phosphorylated forms. Total protein level was monitored by staining with anti-α-tubulin antibodies. Representative results of one out of three independent experiments are shown. (B) Quantification of JNK activation. Data (fold changes in JNK activity) are shown relative to nontreated (−) samples as mean values of three independent measurements ±SD indicated by error bars. Average data for both isoforms of JNK are shown. *p < 0.05.
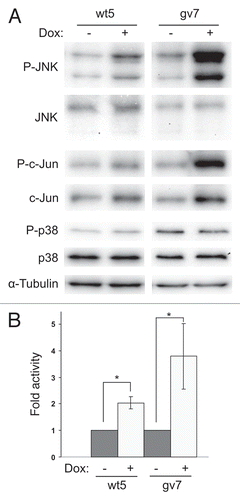
Figure 4 Expression of Chp activates JNK in PC12TetOn cells. (A) wt5 and gv7 cells were grown on collagen IV in 35 mm dishes for 48 hrs in the presence (+) or absence (−) of DOX. Lysates were analyzed by western blotting to detect total levels of JNK, c-Jun, p38MAPK and their phosphorylated forms. Total protein level was monitored by staining with anti-α-tubulin antibodies. Representative results of one out of three independent experiments are shown. (B) Quantification of JNK activation. Data (fold changes in JNK activity) are shown relative to nontreated (−) samples as mean values of three independent measurements ±SD indicated by error bars. Average data for both isoforms of JNK are shown. *p < 0.05.

Figure 5 SP600125 treatment attenuates caspase activation by Chp in PC12 cells. Caspase-3/7 (A), caspase-8 (B) and caspase-9 (C) activities in parental PC12TetOn and wt5 and gv5 cells grown on collagen IV in 96-well plate for 48 hrs in the presence of DOX and in the presence (+) or absence (−) of 10 µM of SP600125 (SP). Data are processed and presented as in . *p < 0.05; n.s.—the difference is not statistically significant.
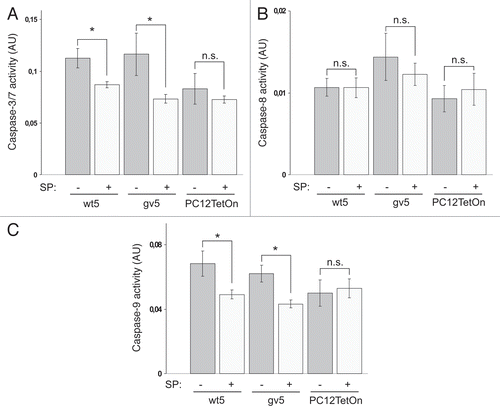
Figure 5 SP600125 treatment attenuates caspase activation by Chp in PC12 cells. Caspase-3/7 (A), caspase-8 (B) and caspase-9 (C) activities in parental PC12TetOn and wt5 and gv5 cells grown on collagen IV in 96-well plate for 48 hrs in the presence of DOX and in the presence (+) or absence (−) of 10 µM of SP600125 (SP). Data are processed and presented as in Figure 3. *p < 0.05; n.s.—the difference is not statistically significant.

Figure 6 Chp activates AP-1-dependent transcription in HE K293 cells. (A) HE K293 cells were cultured in 24-well plate and transfected with plasmids for expression of GFP or indicated GFP-Chp mutants together with firefly luciferase reporter plasmids (‘Basic’-pGL3-Basic, ‘AP-1’-pfLuc-AP-1) and Renilla luciferase reporter plasmid pRL-CMV. Forty eight hrs after transfection cells were lysed and luminescence was measured with Dual Luciferase Reporter Assay System (Promega). Activity of firefly luciferase was normalized to Renilla luciferase activity. Data are presented in relative luminescence units (RLU) as mean values of three independent measurements ± SD indicated by error bars. The data are representative of three independent experiments. An unpaired t-test was used to calculate two-tailed p-value. (B) HE K293 cells were transiently transfected with plasmids for expression of indicated proteins or left non-transfected (lane 1) and grown for 48 hrs. Prior to lysis positive control cells were treated with 10 µg/ml of anisomycin for 30 min to induce activation of JNK (lane 2). Cell lysates were analyzed by western blotting with indicated antibodies. (C) HE K293 cells were cultured and transfected as in (A). In addition, cells were transfected with reporter plasmids and pBK-CMV. After transfection cells were incubated for 48 hrs in growth medium containing SP600125 (SP) at indicated concentration (0, 5, 10 and 20 µM) prior to luciferase activity measurements. Data are processed and presented as in (A). *p = 0.0018.
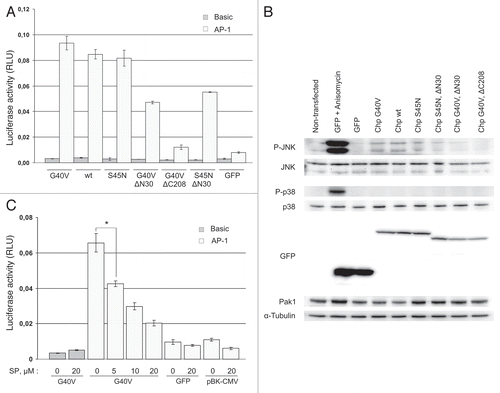
Figure 6 Chp activates AP-1-dependent transcription in HE K293 cells. (A) HE K293 cells were cultured in 24-well plate and transfected with plasmids for expression of GFP or indicated GFP-Chp mutants together with firefly luciferase reporter plasmids (‘Basic’-pGL3-Basic, ‘AP-1’-pfLuc-AP-1) and Renilla luciferase reporter plasmid pRL-CMV. Forty eight hrs after transfection cells were lysed and luminescence was measured with Dual Luciferase Reporter Assay System (Promega). Activity of firefly luciferase was normalized to Renilla luciferase activity. Data are presented in relative luminescence units (RLU) as mean values of three independent measurements ± SD indicated by error bars. The data are representative of three independent experiments. An unpaired t-test was used to calculate two-tailed p-value. (B) HE K293 cells were transiently transfected with plasmids for expression of indicated proteins or left non-transfected (lane 1) and grown for 48 hrs. Prior to lysis positive control cells were treated with 10 µg/ml of anisomycin for 30 min to induce activation of JNK (lane 2). Cell lysates were analyzed by western blotting with indicated antibodies. (C) HE K293 cells were cultured and transfected as in (A). In addition, cells were transfected with reporter plasmids and pBK-CMV. After transfection cells were incubated for 48 hrs in growth medium containing SP600125 (SP) at indicated concentration (0, 5, 10 and 20 µM) prior to luciferase activity measurements. Data are processed and presented as in (A). *p = 0.0018.