778
Views
3
CrossRef citations to date
0
Altmetric
Research Paper

Insufficient ability of Rac1b to perturb cystogenesis

, , , &
Pages 9-15 | Received 23 Sep 2012, Accepted 17 Dec 2012, Published online: 01 Jan 2013

Figures & data

Figure 1. Inducible expression of various AID-tagged Rac1s in MDCK cells. (A) Schematic representation of the Auxin-Inducible Degron (AID) system. Auxin (indole-3-acetic acid) binding to TIR1, a plant F-box protein, promotes the interaction between TIR1 and the AID-tag, which is derived from Arabidopsis thaliana. The Skip1-Cul1-Rbx1 complex bound to TIR1 acts as an E3 ubiquitin ligase to effect polyubiquitylation of the AID-tagged proteins, followed by proteasome-mediated degradation. (B) MDCK-TIR (denoted as control) and various MDCK-Rac1-expressing Fucci cell cycle indicator cells were cultured with 50 μM NAA for 24 h, and further cultured for 24 h with or without NAA, followed by SDS-PAGE and western blotting analysis with anti-myc and anti-Rac1 antibodies to quantify TIR and AID-tagged and endogenous (denoted as Endo) Rac1, respectively. The result shown here is representative of two independent results. (C) Quantification of western blotting in B. After subtracting the background, the expression levels of AID-Rac1 (gray box) and endogenous Rac1 (white box) were normalized to that of TIR. These values were divided by the value of the endogenous Rac1/TIR without NAA. The averages from two independent experiments are shown. (D) MDCK-TIR cells expressing GFP-Syntaxin4 (denoted as Syntaxin4) and various AID-Rac1s (denoted as HA) were cultured on 35-mm glass-bottom dishes in medium without NAA for 24 h. The cells were fixed, immune-stained as described in Materials and Methods, and observed by a confocal microscope. The scale bar is 10 μm. (E) Measurement of guanine nucleotides bound to Rac1 and Rac1b. MDCK cells expressing GFP-Rac1WT and -Rac1b were subjected to quantification of the GTP/GDP ratio as described in the Materials and Methods. Shown in the graph is the average from two independent experiments.
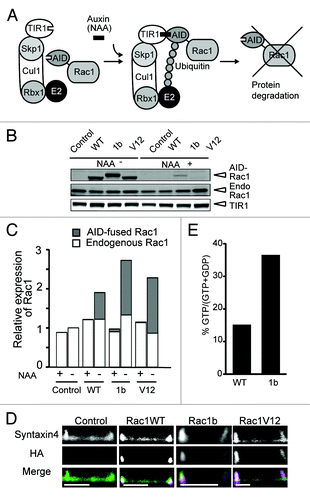
Figure 1. Inducible expression of various AID-tagged Rac1s in MDCK cells. (A) Schematic representation of the Auxin-Inducible Degron (AID) system. Auxin (indole-3-acetic acid) binding to TIR1, a plant F-box protein, promotes the interaction between TIR1 and the AID-tag, which is derived from Arabidopsis thaliana. The Skip1-Cul1-Rbx1 complex bound to TIR1 acts as an E3 ubiquitin ligase to effect polyubiquitylation of the AID-tagged proteins, followed by proteasome-mediated degradation. (B) MDCK-TIR (denoted as control) and various MDCK-Rac1-expressing Fucci cell cycle indicator cells were cultured with 50 μM NAA for 24 h, and further cultured for 24 h with or without NAA, followed by SDS-PAGE and western blotting analysis with anti-myc and anti-Rac1 antibodies to quantify TIR and AID-tagged and endogenous (denoted as Endo) Rac1, respectively. The result shown here is representative of two independent results. (C) Quantification of western blotting in B. After subtracting the background, the expression levels of AID-Rac1 (gray box) and endogenous Rac1 (white box) were normalized to that of TIR. These values were divided by the value of the endogenous Rac1/TIR without NAA. The averages from two independent experiments are shown. (D) MDCK-TIR cells expressing GFP-Syntaxin4 (denoted as Syntaxin4) and various AID-Rac1s (denoted as HA) were cultured on 35-mm glass-bottom dishes in medium without NAA for 24 h. The cells were fixed, immune-stained as described in Materials and Methods, and observed by a confocal microscope. The scale bar is 10 μm. (E) Measurement of guanine nucleotides bound to Rac1 and Rac1b. MDCK cells expressing GFP-Rac1WT and -Rac1b were subjected to quantification of the GTP/GDP ratio as described in the Materials and Methods. Shown in the graph is the average from two independent experiments.

Figure 2. Morphological change upon Rac1 expression. (A) MDCK-TIR (denoted as control) and various MDCK-Rac1 cells expressing H1-Keima (denoted as Nucleus) and GFP-CAAX (denoted as Plasma membrane) were cultured to form cysts in the presence of 50 μM NAA for 10 d. Cysts were washed and further cultured for 5 d with (+) and without (−) NAA and imaged by a confocal microscope. Shown are the representative images from at least two independent experiments. The scale bar is 20 μm. (B) Fluorescent images obtained in were quantified. The numbers of cells in the luminal space were counted from H1-Keima images. Averages with the standard deviation (sd) are shown. *p < 0.05 by Student’s t-test. The numbers of scored cysts were as follows: control (+) 152, control (−) 155; Rac1 WT (+) 663, Rac1WT (−) 554; Rac1b(+) 461, Rac1b (−) 538; Rac1V12 (+) 164, Rac1V12 (−) 172.
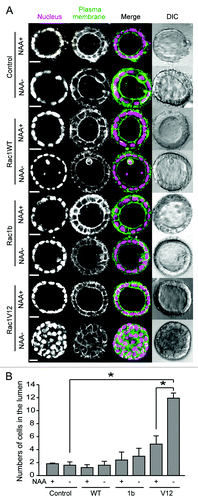
Figure 2. Morphological change upon Rac1 expression. (A) MDCK-TIR (denoted as control) and various MDCK-Rac1 cells expressing H1-Keima (denoted as Nucleus) and GFP-CAAX (denoted as Plasma membrane) were cultured to form cysts in the presence of 50 μM NAA for 10 d. Cysts were washed and further cultured for 5 d with (+) and without (−) NAA and imaged by a confocal microscope. Shown are the representative images from at least two independent experiments. The scale bar is 20 μm. (B) Fluorescent images obtained in Figure 2A were quantified. The numbers of cells in the luminal space were counted from H1-Keima images. Averages with the standard deviation (sd) are shown. *p < 0.05 by Student’s t-test. The numbers of scored cysts were as follows: control (+) 152, control (−) 155; Rac1 WT (+) 663, Rac1WT (−) 554; Rac1b(+) 461, Rac1b (−) 538; Rac1V12 (+) 164, Rac1V12 (−) 172.

Figure 3. Accelerated cell cycle progression upon Rac1 induction. (A) MDCK-TIR and MDCK-Rac1 cells expressing mCherry-hCdt and Venus-hGem were cultured to form cysts in Matrigel containing 50 μM NAA for 10 d and transferred to a collagen gel with or without NAA. One day later, cells were imaged by a confocal microscope. Scale bars = 20 μm. (B) Quantification of (A). The percentage of S/G2/M cells, as indicated by green fluorescent cells, was scored. Data are the averages with s.d. *p < 0.05 by Student’s t-test. The numbers of scored cysts were as follows: control (+) Experiment (Exp)1 23, Exp2 24, Exp3 26, and Exp4 27, control (−), Exp1 23, Exp2 24, Exp3 10, and Exp4 27; Rac1 WT (+) Exp1 26, Exp2 38, Exp3 36, and Exp4 44; Rac1WT (−) Exp1 42, Exp2 40, Exp3 49, and Exp4 45; Rac1b (+) Exp1 23, Exp2 36, Exp3 28, Exp4 34, Exp5 65, and Exp6 65; Rac1b (−) Exp1 26, Exp2 35, Exp3 31, Exp4 38, Exp5 90, and Exp6 74; Rac1V12 (+) Exp1 28, Exp2 20 and Exp3 38; Rac1V12 (−) Exp1 25, Exp2 23 and Exp3 35.
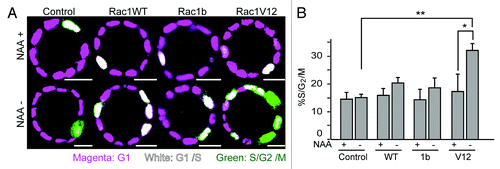
Figure 3. Accelerated cell cycle progression upon Rac1 induction. (A) MDCK-TIR and MDCK-Rac1 cells expressing mCherry-hCdt and Venus-hGem were cultured to form cysts in Matrigel containing 50 μM NAA for 10 d and transferred to a collagen gel with or without NAA. One day later, cells were imaged by a confocal microscope. Scale bars = 20 μm. (B) Quantification of (A). The percentage of S/G2/M cells, as indicated by green fluorescent cells, was scored. Data are the averages with s.d. *p < 0.05 by Student’s t-test. The numbers of scored cysts were as follows: control (+) Experiment (Exp)1 23, Exp2 24, Exp3 26, and Exp4 27, control (−), Exp1 23, Exp2 24, Exp3 10, and Exp4 27; Rac1 WT (+) Exp1 26, Exp2 38, Exp3 36, and Exp4 44; Rac1WT (−) Exp1 42, Exp2 40, Exp3 49, and Exp4 45; Rac1b (+) Exp1 23, Exp2 36, Exp3 28, Exp4 34, Exp5 65, and Exp6 65; Rac1b (−) Exp1 26, Exp2 35, Exp3 31, Exp4 38, Exp5 90, and Exp6 74; Rac1V12 (+) Exp1 28, Exp2 20 and Exp3 38; Rac1V12 (−) Exp1 25, Exp2 23 and Exp3 35.
Supplemental material

Additional material

Download Zip (791.6 KB)

Reprints and Corporate Permissions

Please note: Selecting permissions does not provide access to the full text of the article, please see our help page How do I view content?

To request a reprint or corporate permissions for this article, please click on the relevant link below:

Academic Permissions

Please note: Selecting permissions does not provide access to the full text of the article, please see our help page How do I view content?

Obtain permissions instantly via Rightslink by clicking on the button below:

If you are unable to obtain permissions via Rightslink, please complete and submit this Permissions form. For more information, please visit our Permissions help page.