716
Views
24
CrossRef citations to date
0
Altmetric
Report

Tumor necrosis factor α-mediated restructuring of the Sertoli cell barrier in vitro involves matrix metalloprotease 9 (MMP9), membrane-bound intercellular adhesion molecule-1 (ICAM-1) and the actin cytoskeleton

, , &
Pages 294-303 | Published online: 01 Dec 2012

Figures & data

Table 1. Antibodies used in this study

Figure 1. Cellular distribution and localization of MMP9 in the seminiferous epithelium of the adult rat testis during the epithelial cycle of spermatogenesis. (A) Presence of MMP9 in testis (T), Sertoli (SC, isolated from 20-d-old testes and cultured at high density for 4 d) and germ cell (GC, isolated form 90-d-old testes and used immediately for lysate preparation) lysates (50 μg protein/lane) by immunoblotting. Testin, a Sertoli and Leydig cell protein, was used to assess the purity of germ cells. Actin served as an indicator of equal protein loading. (B) Histogram summarizing results shown in (A). The relative levels of pro- and active-MMP9 detected in Sertoli and germ cell lysates were compared with pro- and active-MMP9 in the testis, whose levels were arbitrarily set at 1. Each bar represents the mean ± SD of n = 3 experiments. **p < 0.01 (ANOVA followed by Dunnett’s post-hoc test). (C) Immunoblot showing the specificity of the anti-MMP9 polyclonal antibody () in seminiferous tubule (ST) lysate (50 μg protein). This antibody was used subsequently for IHC and IF staining. Mr, molecular weight; M, MagicMark™ XP Western Protein Standard (Invitrogen). (D) IHC and IF staining of MMP9 in paraffin-embedded (5 μm) and frozen (7 μm) adult testis cross-sections, respectively. MMP9 immunoreactivity appeared as a brownish precipitate in IHC experiments (a–h) and as a reddish precipitate in IF experiments (i–p). Nuclei were visualized with DAPI (blue, i–p). Stages of the seminiferous epithelial cycle are denoted as Roman numerals (b–h and j–p). Insets (b, e and f) are magnified images corresponding to boxed areas within the same panel. Specificity was assessed when 10% normal goat serum (vol/vol) was used instead of anti-MMP9 IgG (a, right panel). Dashed lines (j–p) mark the periphery of seminiferous tubules. Scale bars, 25 μm. MMP9 immunoreactivity associated intensely with round spermatids at stages I-VII (red arrowheads in b and j, and insert in b) and moderately/weakly with elongating spermatids at stages VIII-XII (blue arrowheads in e and m, right-most inset in e, inset in f). MMP9 also associated strongly with pachytene and diplotene spermatocytes at stages VIII–XIII (green arrowheads in d and l, left-most insert in e). Weak staining was also detected in Sertoli cells (asterisks in b and k).
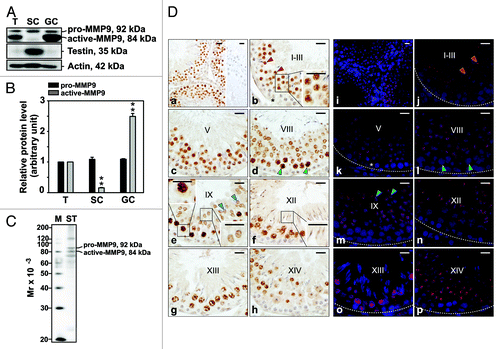
Figure 1. Cellular distribution and localization of MMP9 in the seminiferous epithelium of the adult rat testis during the epithelial cycle of spermatogenesis. (A) Presence of MMP9 in testis (T), Sertoli (SC, isolated from 20-d-old testes and cultured at high density for 4 d) and germ cell (GC, isolated form 90-d-old testes and used immediately for lysate preparation) lysates (50 μg protein/lane) by immunoblotting. Testin, a Sertoli and Leydig cell protein, was used to assess the purity of germ cells. Actin served as an indicator of equal protein loading. (B) Histogram summarizing results shown in (A). The relative levels of pro- and active-MMP9 detected in Sertoli and germ cell lysates were compared with pro- and active-MMP9 in the testis, whose levels were arbitrarily set at 1. Each bar represents the mean ± SD of n = 3 experiments. **p < 0.01 (ANOVA followed by Dunnett’s post-hoc test). (C) Immunoblot showing the specificity of the anti-MMP9 polyclonal antibody (Table 1) in seminiferous tubule (ST) lysate (50 μg protein). This antibody was used subsequently for IHC and IF staining. Mr, molecular weight; M, MagicMark™ XP Western Protein Standard (Invitrogen). (D) IHC and IF staining of MMP9 in paraffin-embedded (5 μm) and frozen (7 μm) adult testis cross-sections, respectively. MMP9 immunoreactivity appeared as a brownish precipitate in IHC experiments (a–h) and as a reddish precipitate in IF experiments (i–p). Nuclei were visualized with DAPI (blue, i–p). Stages of the seminiferous epithelial cycle are denoted as Roman numerals (b–h and j–p). Insets (b, e and f) are magnified images corresponding to boxed areas within the same panel. Specificity was assessed when 10% normal goat serum (vol/vol) was used instead of anti-MMP9 IgG (a, right panel). Dashed lines (j–p) mark the periphery of seminiferous tubules. Scale bars, 25 μm. MMP9 immunoreactivity associated intensely with round spermatids at stages I-VII (red arrowheads in b and j, and insert in b) and moderately/weakly with elongating spermatids at stages VIII-XII (blue arrowheads in e and m, right-most inset in e, inset in f). MMP9 also associated strongly with pachytene and diplotene spermatocytes at stages VIII–XIII (green arrowheads in d and l, left-most insert in e). Weak staining was also detected in Sertoli cells (asterisks in b and k).

Figure 2. Cellular localization and stage-specific expression of MT1-MMP in the seminiferous epithelium of the adult rat testis during the epithelial cycle of spermatogenesis. (A) Presence of MT1-MMP in testis (T), Sertoli (SC, see legend to for details) and germ cell (GC, see legend to for details) lysates (50 μg protein/lane) by immunoblotting. Actin served as an indicator of equal protein loading. (B) Histogram summarizing results shown in (A). The relative level of MT1-MMP detected in Sertoli and germ cell lysates was compared with MT1-MMP in the testis, whose level was arbitrarily set at 1. Each bar represents the mean ± SD of n = 3 experiments. *p < 0.05; **p < 0.01 (ANOVA followed by Dunnett’s post-hoc test). (C) Immunoblot showing the specificity of an anti-MT1-MMP polyclonal antibody () in testis lysate (50 μg protein). This antibody was used subsequently for IHC and IF staining. Mr, molecular weight; M, MagicMark™ XP Western Protein Standard (Invitrogen). (D) IHC and IF staining of MT1-MMP in paraffin-embedded (5 μm) and frozen (7 μm) adult testis cross-sections, respectively. MT1-MMP immunoreactivity appeared as a brownish precipitate in IHC experiments (a–h) and as a reddish precipitate in IF experiments (i–p). Nuclei were visualized with DAPI (blue, i–p). Stages of the seminiferous epithelial cycle are denoted as Roman numerals (b–h, and j–p). Insets (e and i) are magnified images corresponding to boxed areas within the same panel. Specificity was assessed when 10% normal goat serum (vol/vol) was used instead of MT1-MMP IgG (a, right panel). Dashed lines (j–p) mark the periphery of seminiferous tubules. Scale bars, 25 μm. Immunoreactive MT1-MMP immunoreactivity associated intensely with residual bodies (arrows in d) and weakly with pachytene spermatocytes, and round and elongating/elongated spermatids (blue arrowheads in e).
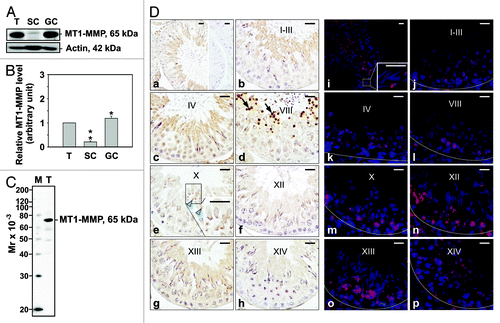
Figure 2. Cellular localization and stage-specific expression of MT1-MMP in the seminiferous epithelium of the adult rat testis during the epithelial cycle of spermatogenesis. (A) Presence of MT1-MMP in testis (T), Sertoli (SC, see legend to Fig. 1 for details) and germ cell (GC, see legend to Fig. 1 for details) lysates (50 μg protein/lane) by immunoblotting. Actin served as an indicator of equal protein loading. (B) Histogram summarizing results shown in (A). The relative level of MT1-MMP detected in Sertoli and germ cell lysates was compared with MT1-MMP in the testis, whose level was arbitrarily set at 1. Each bar represents the mean ± SD of n = 3 experiments. *p < 0.05; **p < 0.01 (ANOVA followed by Dunnett’s post-hoc test). (C) Immunoblot showing the specificity of an anti-MT1-MMP polyclonal antibody (Table 1) in testis lysate (50 μg protein). This antibody was used subsequently for IHC and IF staining. Mr, molecular weight; M, MagicMark™ XP Western Protein Standard (Invitrogen). (D) IHC and IF staining of MT1-MMP in paraffin-embedded (5 μm) and frozen (7 μm) adult testis cross-sections, respectively. MT1-MMP immunoreactivity appeared as a brownish precipitate in IHC experiments (a–h) and as a reddish precipitate in IF experiments (i–p). Nuclei were visualized with DAPI (blue, i–p). Stages of the seminiferous epithelial cycle are denoted as Roman numerals (b–h, and j–p). Insets (e and i) are magnified images corresponding to boxed areas within the same panel. Specificity was assessed when 10% normal goat serum (vol/vol) was used instead of MT1-MMP IgG (a, right panel). Dashed lines (j–p) mark the periphery of seminiferous tubules. Scale bars, 25 μm. Immunoreactive MT1-MMP immunoreactivity associated intensely with residual bodies (arrows in d) and weakly with pachytene spermatocytes, and round and elongating/elongated spermatids (blue arrowheads in e).

Figure 3. Effects of TNFα on the steady-state levels of integral membrane, scaffolding and regulatory proteins in Sertoli cells in vitro. Sertoli cells were cultured at high density on Matrigel™-coated 12-well dishes as described in Materials and Methods. On day 4 (designated as 0 h in this figure), TNFα (25 ng/ml) was added into Sertoli cell cultures, and cells were terminated at specific time points thereafter for lysate preparation. TNFα was dissolved in 10 mM NaH2PO4 pH 7.4 at 22°C containing 0.15 M NaCl and 0.1% BSA (wt/vol). The control consisted of culturing Sertoli cells in media containing an equivalent amount of BSA. (A) Immunoblots of selected proteins involved in the regulation and in the maintenance of Sertoli cell barrier function. Actin served as an indicator of equal protein loading. (B) Histograms summarizing results shown in (A) from at least three independent experiments. Histograms are not shown for proteins whose levels did not change significantly. Each data point was normalized against its corresponding actin data point and then against the protein level at 0 h, which was arbitrarily set as 1. Each bar represents the mean ± SD of n = 3–4 experiments. **p < 0.01 (ANOVA followed by Dunnett's post-hoc test). n.d., not determined.
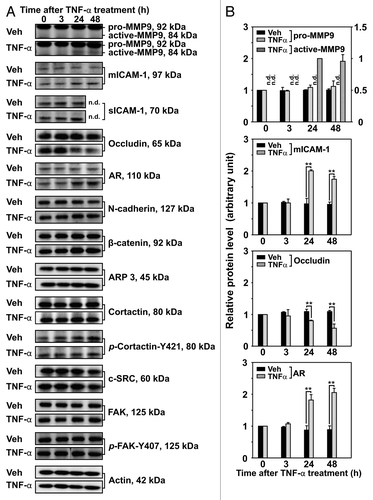
Figure 3. Effects of TNFα on the steady-state levels of integral membrane, scaffolding and regulatory proteins in Sertoli cells in vitro. Sertoli cells were cultured at high density on Matrigel™-coated 12-well dishes as described in Materials and Methods. On day 4 (designated as 0 h in this figure), TNFα (25 ng/ml) was added into Sertoli cell cultures, and cells were terminated at specific time points thereafter for lysate preparation. TNFα was dissolved in 10 mM NaH2PO4 pH 7.4 at 22°C containing 0.15 M NaCl and 0.1% BSA (wt/vol). The control consisted of culturing Sertoli cells in media containing an equivalent amount of BSA. (A) Immunoblots of selected proteins involved in the regulation and in the maintenance of Sertoli cell barrier function. Actin served as an indicator of equal protein loading. (B) Histograms summarizing results shown in (A) from at least three independent experiments. Histograms are not shown for proteins whose levels did not change significantly. Each data point was normalized against its corresponding actin data point and then against the protein level at 0 h, which was arbitrarily set as 1. Each bar represents the mean ± SD of n = 3–4 experiments. **p < 0.01 (ANOVA followed by Dunnett's post-hoc test). n.d., not determined.

Figure 4. Localization of MMP9 and MT1-MMP in Sertoli cells cultured in the presence of TNFα. Sertoli cells (0.04 × 10⁶ cells/cm2) were cultured on Matrigel™-coated micro cover glasses for 4 d and incubated with TNFα (25 ng/ml) for 24 h as described in Materials and Methods. Thereafter, cells were processed for the immunofluorescent visualization of MMP9 (red, a and b) and MT1-MMP (red, c and d). Nuclei were visualized with DAPI (blue, a–d). Images encircled in blue boxes and shown to the immediate right of a–h are enlarged images corresponding to boxed areas within a–h. Gray scale images (e–h) are included to better depict changes in MMP9 and MT1-MMP. Scale bars, 20 μm.
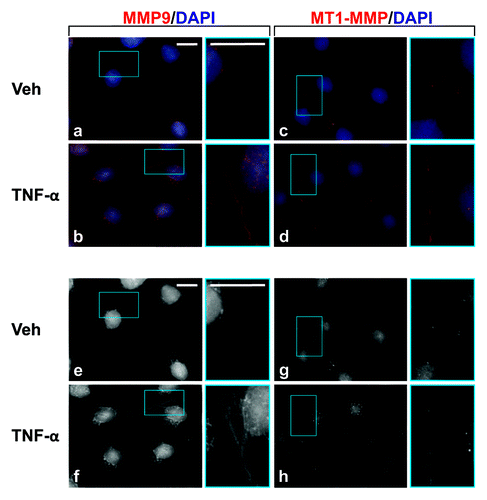
Figure 4. Localization of MMP9 and MT1-MMP in Sertoli cells cultured in the presence of TNFα. Sertoli cells (0.04 × 10⁶ cells/cm2) were cultured on Matrigel™-coated micro cover glasses for 4 d and incubated with TNFα (25 ng/ml) for 24 h as described in Materials and Methods. Thereafter, cells were processed for the immunofluorescent visualization of MMP9 (red, a and b) and MT1-MMP (red, c and d). Nuclei were visualized with DAPI (blue, a–d). Images encircled in blue boxes and shown to the immediate right of a–h are enlarged images corresponding to boxed areas within a–h. Gray scale images (e–h) are included to better depict changes in MMP9 and MT1-MMP. Scale bars, 20 μm.

Figure 5. Effects of TNFα on protein distribution within Sertoli cells. Sertoli cells (0.04 × 10⁶ cells/cm2) were cultured on Matrigel™-coated micro cover glasses for 4 d and treated with TNFα (25 ng/ml) for 24 h as described in Materials and Methods. Sertoli cells were then dual-labeled for occludin (red)/ZO-1 (green), or labeled for F-actin or cortactin (both green). Corresponding images were merged to show areas of co-localization (orange, A). Nuclei were visualized with DAPI (blue, A and B). Scale bars, 20 μm.
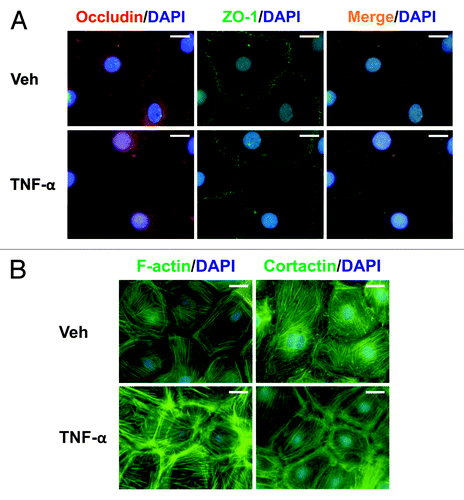
Figure 5. Effects of TNFα on protein distribution within Sertoli cells. Sertoli cells (0.04 × 10⁶ cells/cm2) were cultured on Matrigel™-coated micro cover glasses for 4 d and treated with TNFα (25 ng/ml) for 24 h as described in Materials and Methods. Sertoli cells were then dual-labeled for occludin (red)/ZO-1 (green), or labeled for F-actin or cortactin (both green). Corresponding images were merged to show areas of co-localization (orange, A). Nuclei were visualized with DAPI (blue, A and B). Scale bars, 20 μm.