799
Views
14
CrossRef citations to date
0
Altmetric
Research Paper

Molecular basis of transcription initiation in Archaea

Pages 103-111 | Published online: 01 Sep 2010

Figures & data

Figure 1 Cryo-EM analysis of apo-RNAP. (A) Negative staining EM and selected class-averages of the P. furiosus apo-RNAP. Each class-average is composed of about 10–30 raw images and was aligned against an initial 3-D reference to define its orientation parameters. (B) cryo-EM micrograph and selected class-averages, illustrated with reversed contrast. (C) Fitting of the S. solfataricus apo-RNAP crystal structure (PDB 2PMZ)Citation10 into the cryo-EM refined model. The crystal structure was manually fitted in chIMeRa and the fit was refined with a least-square minimization algorithm (see Materials and Methods). Scale bar = 65 nm in (A and B); 5 nm in (C).
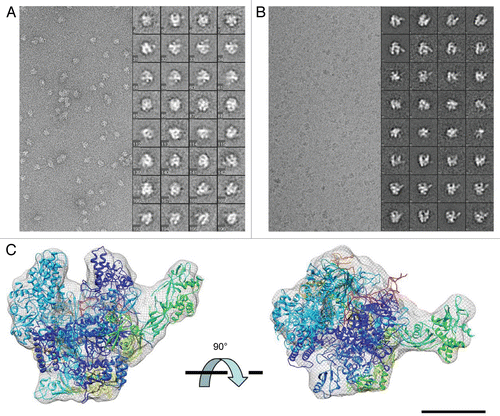
Figure 1 Cryo-EM analysis of apo-RNAP. (A) Negative staining EM and selected class-averages of the P. furiosus apo-RNAP. Each class-average is composed of about 10–30 raw images and was aligned against an initial 3-D reference to define its orientation parameters. (B) cryo-EM micrograph and selected class-averages, illustrated with reversed contrast. (C) Fitting of the S. solfataricus apo-RNAP crystal structure (PDB 2PMZ)Citation10 into the cryo-EM refined model. The crystal structure was manually fitted in chIMeRa and the fit was refined with a least-square minimization algorithm (see Materials and Methods). Scale bar = 65 nm in (A and B); 5 nm in (C).

Figure 2 Functional analysis and purification of P. furiosus PIC (A, left) silver stain gel of purified RNAP from P. furiosus and reconstituted transcription. RNAP, TBP and/or TFB were added as shown. Asterisk, minor cryptic initiation site in the absence of TBP/TFB; Arrow, correct initiation site from the T6 promoter. (B) Coomassie-stained gel for PIC cross-linking. The letters B through P denote RNAP subunits; TBP and TFB are also indicated. (C) Elution profile for the cross-linked PIC purified with size-exclusion chromatography on a 24 ml Superdex 200 column. Time = 7 min is the column dead volume; the wavelength was set to 280 nm.
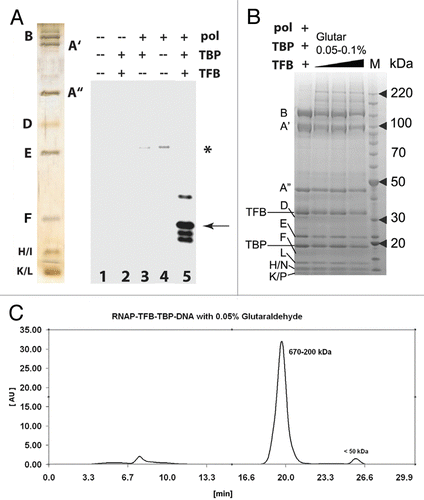
Figure 2 Functional analysis and purification of P. furiosus PIC (A, left) silver stain gel of purified RNAP from P. furiosus and reconstituted transcription. RNAP, TBP and/or TFB were added as shown. Asterisk, minor cryptic initiation site in the absence of TBP/TFB; Arrow, correct initiation site from the T6 promoter. (B) Coomassie-stained gel for PIC cross-linking. The letters B through P denote RNAP subunits; TBP and TFB are also indicated. (C) Elution profile for the cross-linked PIC purified with size-exclusion chromatography on a 24 ml Superdex 200 column. Time = 7 min is the column dead volume; the wavelength was set to 280 nm.

Figure 3 EM analysis of the P. furiosus PIC. (A) Negatively-stained micrograph and selected class-averages of the PIC (RNAP /TBP/TFB/DNA complex). Each class-average is composed of about 10–30 raw images and was aligned against an initial RNAP 3-D reference to define its orientation parameters. (B) PIC reconstruction (top) compared to apo-RNAP (bottom) in two different orientations. Extra density within PIC structure is indicated by red arrows. (C) Overlay of the RNAP cryo-EM structure (from ) or the X-ray structureCitation10 onto the EM density map of the PIC. A red star highlights extra density.
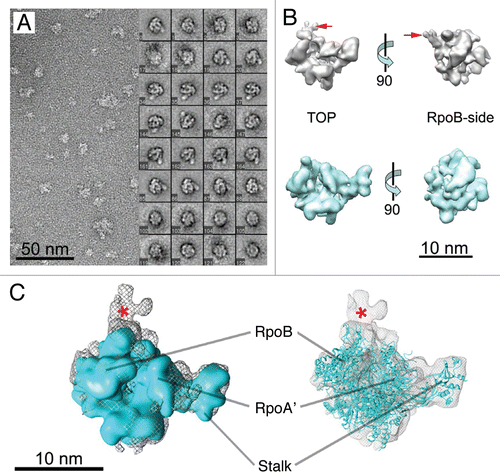
Figure 3 EM analysis of the P. furiosus PIC. (A) Negatively-stained micrograph and selected class-averages of the PIC (RNAP /TBP/TFB/DNA complex). Each class-average is composed of about 10–30 raw images and was aligned against an initial RNAP 3-D reference to define its orientation parameters. (B) PIC reconstruction (top) compared to apo-RNAP (bottom) in two different orientations. Extra density within PIC structure is indicated by red arrows. (C) Overlay of the RNAP cryo-EM structure (from Fig. 1) or the X-ray structureCitation10 onto the EM density map of the PIC. A red star highlights extra density.

Figure 4 Localization of TBP/TFB within the P. furiosus PIC. (A) Back-view of the PIC EM structure (grey mesh) with fitted DNA/TBP/TFB crystal structure (PDB ID 1AIS).Citation40 (B) Same as (A), but the fit was improved by rotating the DNA/TBP/TFB complex about 30 degrees. (C) Proposed model of Archaeal PIC: top-view of the PIC EM density (grey) according to the improved fit shown in (B). (D) High-resolution model proposed for the Archaeal PIC (RNAP from PDB ID 2PMZ;Citation10 DNA/TBP/TFIIB from PDB ID 3K1F).Citation22 Scale bar = 5 nm in (A and B) and 10 nm in (C and D).
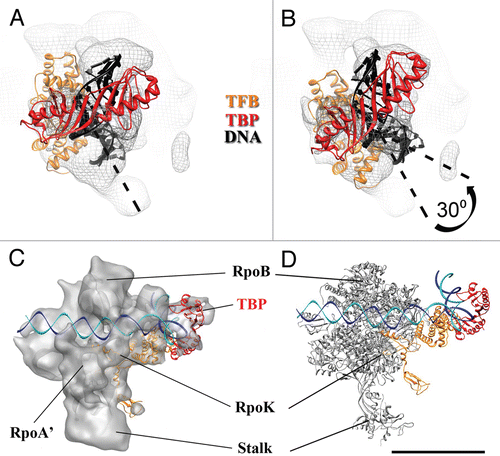
Figure 4 Localization of TBP/TFB within the P. furiosus PIC. (A) Back-view of the PIC EM structure (grey mesh) with fitted DNA/TBP/TFB crystal structure (PDB ID 1AIS).Citation40 (B) Same as (A), but the fit was improved by rotating the DNA/TBP/TFB complex about 30 degrees. (C) Proposed model of Archaeal PIC: top-view of the PIC EM density (grey) according to the improved fit shown in (B). (D) High-resolution model proposed for the Archaeal PIC (RNAP from PDB ID 2PMZ;Citation10 DNA/TBP/TFIIB from PDB ID 3K1F).Citation22 Scale bar = 5 nm in (A and B) and 10 nm in (C and D).

Figure 5 A conserved core architecture within archaeal and eukaryotic PIC? High-resolution model for (A) archaeal PIC. and (B) Yeast RNAP II/TFIIB complex from PDB ID 3K1F.Citation22 (C) Subunits composition of Archaea RNAP and Eukaryotic RNAP II. Scale bar = 10 nm.
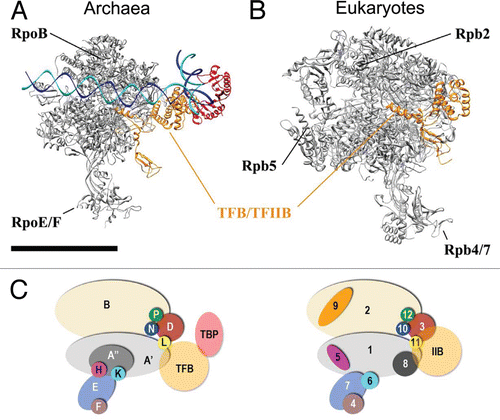
Figure 5 A conserved core architecture within archaeal and eukaryotic PIC? High-resolution model for (A) archaeal PIC. and (B) Yeast RNAP II/TFIIB complex from PDB ID 3K1F.Citation22 (C) Subunits composition of Archaea RNAP and Eukaryotic RNAP II. Scale bar = 10 nm.

Table 1 Subunit composition, molecular weight and nomenclature of multi-subunit RNAPs

Supplemental material

Additional material

Download Zip (5.4 MB)