1,469
Views
18
CrossRef citations to date
0
Altmetric
Research Paper

Acidic pH induced STM1485 gene is essential for intracellular replication of Salmonella

, , , , , & show all
Pages 122-135 | Published online: 01 Mar 2012

Figures & data

Figure 1. In vitro characterization of the ΔSTM1485. (A) and (B) Growth kinetics of the ΔSTM1485 and its parental strain at acidic pH. Growth kinetics was done in LB (A) and LPM (B) at pH 4.5 buffered with sodium citrate. Log (C) and stationary (D) phase acid tolerance response (ATR) of the ΔSTM1485 strain. Overnight grown cultures were sub cultured into LPM media at pH 7.0 to an OD600 nm of 0.3 (log phase) or 1.5 (stationary). For adaptation, bacteria were resuspended in LPM media at pH 4.5 for 2 h, followed by shifting of pH to 3.0 and growth for 2 h. Unadapted cells were directly shifted to pH 3.0. Number of viable bacteria was enumerated by plating on selective LB plates. Shown is the data of two independent experiments. Filled circles, WT; open circles, ΔSTM1485; NS, not significant.
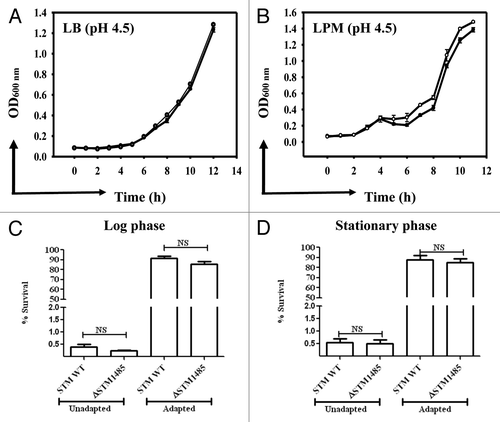
Figure 1. In vitro characterization of the ΔSTM1485. (A) and (B) Growth kinetics of the ΔSTM1485 and its parental strain at acidic pH. Growth kinetics was done in LB (A) and LPM (B) at pH 4.5 buffered with sodium citrate. Log (C) and stationary (D) phase acid tolerance response (ATR) of the ΔSTM1485 strain. Overnight grown cultures were sub cultured into LPM media at pH 7.0 to an OD600 nm of 0.3 (log phase) or 1.5 (stationary). For adaptation, bacteria were resuspended in LPM media at pH 4.5 for 2 h, followed by shifting of pH to 3.0 and growth for 2 h. Unadapted cells were directly shifted to pH 3.0. Number of viable bacteria was enumerated by plating on selective LB plates. Shown is the data of two independent experiments. Filled circles, WT; open circles, ΔSTM1485; NS, not significant.

Figure 2. STM1485 gene expression in in vitro grown bacteria and intracellular bacteria. (A) and (B) cDNA was synthesized from the RNA isolated from in vitro grown bacteria (in LB pH 7.0 and 4.5 for 4 h) and from infected RAW264.7 cells (4 h post-infection) with and without BAF treatment. STM1485 and spiC (representative from SPI-2 island) were amplified by PCR. 16s rRNA served as internal control. (C) Expression of the His tagged STM1485 protein from STM1485::6xHis knock in strain grown in LB at pH (4.5 and 7.0) by immunoblot. Ribosome Recycling Factor (RRF) probing was done to equalize the amount of bacterial protein loaded for the SDS PAGE. Numbers below the gels indicate the values of densitometric image analysis using Multi Guage software. Images are representative of two independent experiments.
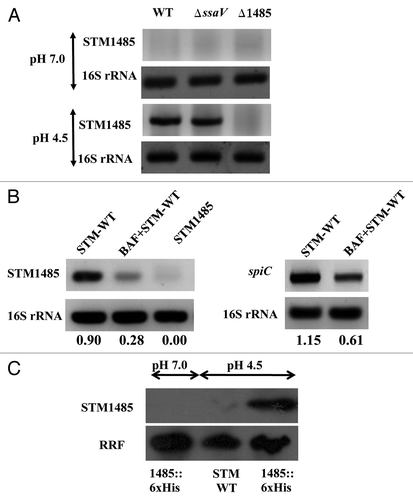
Figure 2. STM1485 gene expression in in vitro grown bacteria and intracellular bacteria. (A) and (B) cDNA was synthesized from the RNA isolated from in vitro grown bacteria (in LB pH 7.0 and 4.5 for 4 h) and from infected RAW264.7 cells (4 h post-infection) with and without BAF treatment. STM1485 and spiC (representative from SPI-2 island) were amplified by PCR. 16s rRNA served as internal control. (C) Expression of the His tagged STM1485 protein from STM1485::6xHis knock in strain grown in LB at pH (4.5 and 7.0) by immunoblot. Ribosome Recycling Factor (RRF) probing was done to equalize the amount of bacterial protein loaded for the SDS PAGE. Numbers below the gels indicate the values of densitometric image analysis using Multi Guage software. Images are representative of two independent experiments.

Figure 3. Evaluation of STM1485 expression in epithelial cells (INT-407, Caco-2 and HeLa). STM1485 expression was studied using (A) RT-PCR assay. (B) Immunoblot method using the STM1485::6xHis tagged strain. Bacteria were isolated from the infected epithelial cells at 6th h post infection. Bacteria grown in DMEM at 37°C under 5% CO2 were served as control to determine expression outside host cells. Numbers below the gels indicate the values of densitometric image analysis using Multi Guage software. Results are representative of two independent experiments.
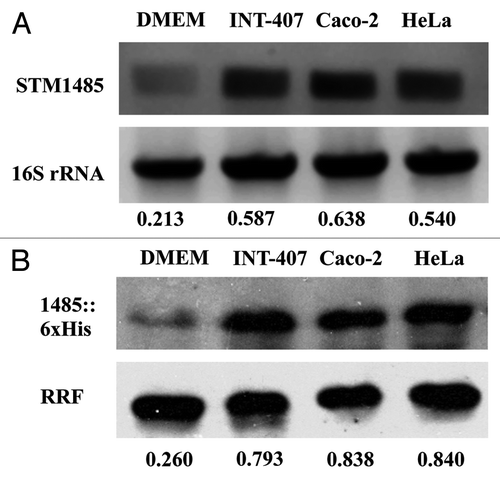
Figure 3. Evaluation of STM1485 expression in epithelial cells (INT-407, Caco-2 and HeLa). STM1485 expression was studied using (A) RT-PCR assay. (B) Immunoblot method using the STM1485::6xHis tagged strain. Bacteria were isolated from the infected epithelial cells at 6th h post infection. Bacteria grown in DMEM at 37°C under 5% CO2 were served as control to determine expression outside host cells. Numbers below the gels indicate the values of densitometric image analysis using Multi Guage software. Results are representative of two independent experiments.

Figure 4. Invasion and intracellular fold replication of the ΔSTM1485 strain inside epithelial cells (INT-407, Caco-2 and HeLa). (A) Invasion of ΔSTM1485 was determined by lysing the infected cells 30 min post-infection. (B) Fold replication was determined by lysing the cells infected with the WT and the ΔSTM1485 at 2 h and 16 h post infection. Graphs are representative of three independent experiments, each with triplicate samples. Standard error bars are shown. (**p < 0.005) (Student's t-test).
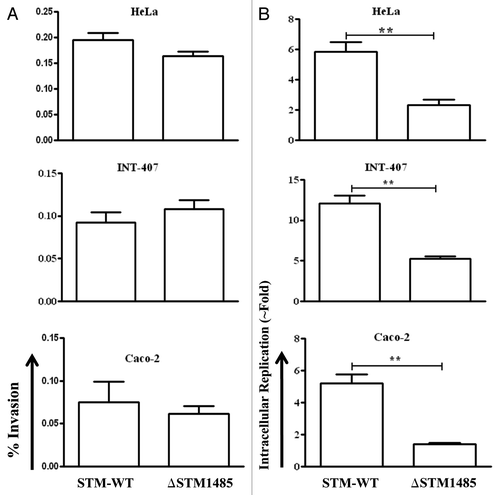
Figure 4. Invasion and intracellular fold replication of the ΔSTM1485 strain inside epithelial cells (INT-407, Caco-2 and HeLa). (A) Invasion of ΔSTM1485 was determined by lysing the infected cells 30 min post-infection. (B) Fold replication was determined by lysing the cells infected with the WT and the ΔSTM1485 at 2 h and 16 h post infection. Graphs are representative of three independent experiments, each with triplicate samples. Standard error bars are shown. (**p < 0.005) (Student's t-test).

Figure 5. Intracellular survival assay of ΔSTM1485 in mouse macrophage cells (A) and complementation studies in INT-407 (B) and RAW264.7 (C). Cells were infected with WT or ΔSTM1485 or ΔSTM1485pQE601485 strains were lysed at 2 and 16 h post infection. Bacterial load was shown as fold increase in CFU from 2 h to 16 h. Graphs are representative of two independent experiments with similar results. Statistical significance was defined as follows (**p < 0.005) (Student's t-test).
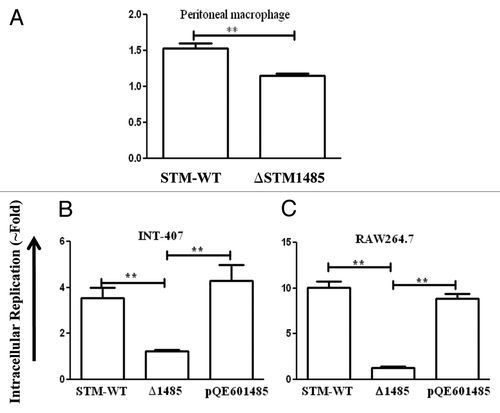
Figure 5. Intracellular survival assay of ΔSTM1485 in mouse macrophage cells (A) and complementation studies in INT-407 (B) and RAW264.7 (C). Cells were infected with WT or ΔSTM1485 or ΔSTM1485pQE601485 strains were lysed at 2 and 16 h post infection. Bacterial load was shown as fold increase in CFU from 2 h to 16 h. Graphs are representative of two independent experiments with similar results. Statistical significance was defined as follows (**p < 0.005) (Student's t-test).

Figure 6. Effect of phagosomal pH neutralization on intracellular replication of ΔSTM1485 strain. RAW264.7 cells were pretreated with (A) bafilomycin A1 (50 nM), (B) Folimycin (100 nM) and (C) NH4Cl (100 mM) followed by infection as described in materials and methods. Infected cells were lysed at 2 h and 16 h post infection and bacterial load was shown as fold increase in CFU from 2 h to 16 h. Graphs are representative of three independent experiments with similar results. Statistical significance was defined as follows (*p < 0.05, **p < 0.005) (Student's t-test).
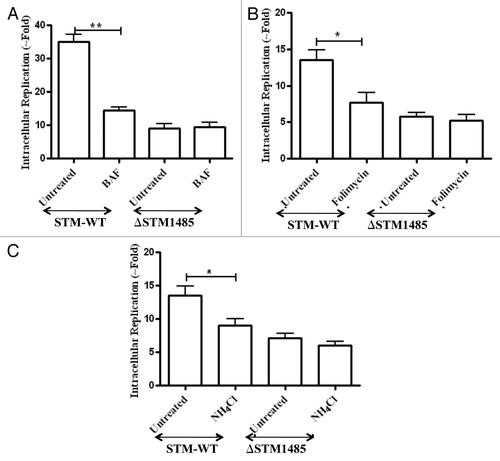
Figure 6. Effect of phagosomal pH neutralization on intracellular replication of ΔSTM1485 strain. RAW264.7 cells were pretreated with (A) bafilomycin A1 (50 nM), (B) Folimycin (100 nM) and (C) NH4Cl (100 mM) followed by infection as described in materials and methods. Infected cells were lysed at 2 h and 16 h post infection and bacterial load was shown as fold increase in CFU from 2 h to 16 h. Graphs are representative of three independent experiments with similar results. Statistical significance was defined as follows (*p < 0.05, **p < 0.005) (Student's t-test).

Figure 7. STM1485 is required for the SPI-2 translocon formation. Surface translocation of SPI-2 encoded translocon proteins (SseB and SseD) in the ΔSTM1485 (A). WT and ΔSTM1485 were grown in ISM media at pH 5.0 and then cell pellet, surface and supernatant fractions were isolated as described in Materials and Methods. By immunoblotting, the presence of SseB protein in all three fractions was analyzed. Secretion of SPI-2 effector protein (B). STM-WT, ΔSTM1485 and ΔssaV mutant strains carrying the His-tagged SseJ construct were grown under SPI-2 inducing conditions (F-media, pH 5.0) for overnight and secreted proteins were precipitated from the culture supernatant. We evaluated the cell pellet and supernatant fractions for intracellular and secreted levels of the SseJ-His by immunoblotting. Detection of SseD in vitro and in intracellular bacteria (C and D). WT-GFP and ΔSTM1485-GFP were grown in ISM media at pH 5.0 for overnight. Bacteria were harvested and preceded for immunostaining (C). RAW264.7 cells were infected with WT-GFP and ΔSTM1485-GFP. Twelve hours post-infection cells were fixed and immunostained (D). Samples were analyzed using a confocal laser scanning microscope (LSM Meta, Zeiss). Note the appearance of SseD (red) on the surface of intracellular bacteria (green) (*) and also distant to the bacteria (arrow). Scale bar represent the 2 µm.
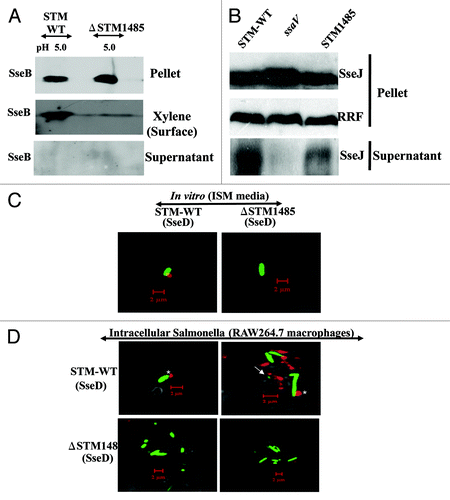
Figure 7. STM1485 is required for the SPI-2 translocon formation. Surface translocation of SPI-2 encoded translocon proteins (SseB and SseD) in the ΔSTM1485 (A). WT and ΔSTM1485 were grown in ISM media at pH 5.0 and then cell pellet, surface and supernatant fractions were isolated as described in Materials and Methods. By immunoblotting, the presence of SseB protein in all three fractions was analyzed. Secretion of SPI-2 effector protein (B). STM-WT, ΔSTM1485 and ΔssaV mutant strains carrying the His-tagged SseJ construct were grown under SPI-2 inducing conditions (F-media, pH 5.0) for overnight and secreted proteins were precipitated from the culture supernatant. We evaluated the cell pellet and supernatant fractions for intracellular and secreted levels of the SseJ-His by immunoblotting. Detection of SseD in vitro and in intracellular bacteria (C and D). WT-GFP and ΔSTM1485-GFP were grown in ISM media at pH 5.0 for overnight. Bacteria were harvested and preceded for immunostaining (C). RAW264.7 cells were infected with WT-GFP and ΔSTM1485-GFP. Twelve hours post-infection cells were fixed and immunostained (D). Samples were analyzed using a confocal laser scanning microscope (LSM Meta, Zeiss). Note the appearance of SseD (red) on the surface of intracellular bacteria (green) (*) and also distant to the bacteria (arrow). Scale bar represent the 2 µm.

Figure 8. Co-localization of GFP expressing bacteria, latex beads and heat killed bacteria with TROv in RAW264.7 cells (A). Prior to infection, RAW264.7 cells were pulse-chased with 50 μg/ml of Texas Red-Ovalbumin (TROv) for 30 min, washed and then incubated for another 30 min. Then cells were infected with GFP expressing WT and ΔSTM1485 and fixed at different time points. Cells were also incubated with latex GFP beads and heat killed bacteria. Heat killed bacteria were detected with antibody specific to Salmonella LPS followed by FITC-conjugated secondary antibody. Samples were analyzed using a confocal laser scanning microscope (LSM Meta, Zeiss). At least 50 cells were counted in each case in each experiment. (B) Results of three experiments in which SCVs from cells infected with each strain or phagosomes containing latex beads and heat killed bacteria were scored for TROv co-localization at 2, 8 and 16 h post infection. Shown are the representative images of a single XY section taken from Z-stack. The values are given as mean ± standard error in percentages. Statistical significance was defined as follows (**p < 0.005) (Student's t-test).
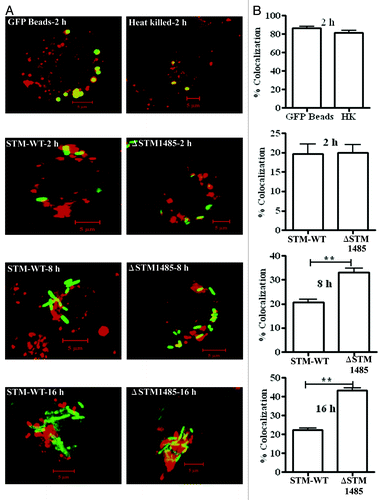
Figure 8. Co-localization of GFP expressing bacteria, latex beads and heat killed bacteria with TROv in RAW264.7 cells (A). Prior to infection, RAW264.7 cells were pulse-chased with 50 μg/ml of Texas Red-Ovalbumin (TROv) for 30 min, washed and then incubated for another 30 min. Then cells were infected with GFP expressing WT and ΔSTM1485 and fixed at different time points. Cells were also incubated with latex GFP beads and heat killed bacteria. Heat killed bacteria were detected with antibody specific to Salmonella LPS followed by FITC-conjugated secondary antibody. Samples were analyzed using a confocal laser scanning microscope (LSM Meta, Zeiss). At least 50 cells were counted in each case in each experiment. (B) Results of three experiments in which SCVs from cells infected with each strain or phagosomes containing latex beads and heat killed bacteria were scored for TROv co-localization at 2, 8 and 16 h post infection. Shown are the representative images of a single XY section taken from Z-stack. The values are given as mean ± standard error in percentages. Statistical significance was defined as follows (**p < 0.005) (Student's t-test).

Table 1. Strains and plasmids used in this study

Table 2. Competitive Indices of mixed infections using the WT, ΔSTM1485 and the pQE601485 complemented strains

Supplemental material

Additional material

Download Zip (141.4 KB)